Trading Divergences
What if there was a low risk way to sell near the top or buy near the bottom of a trend?
What if you were already in a long position and you could know ahead of time the perfect place to exit instead of watching your unrealized gains, a.k.a your potential Aston Martin down payment, vanish before your eyes because your trade reverses direction?
What if you believe a currency pair will continue to fall but would like to short at a better price or a less risky entry?
Well guess what? There is a way! It’s called divergence trading.
In a nutshell, divergence can be seen by comparing price action and the movement of an indicator. It doesn’t really matter what indicator you use. You can use RSI, MACD, the stochastic, CCI, etc.
The great thing about divergences is that you can use them as a leading indicator, and after some practice it’s not too difficult to spot.
When traded properly, you can be consistently profitable with divergences. The best thing about divergences is that you’re usually buying near the bottom or selling near the top. This makes the risk on your trades are very small relative to your potential reward.
Cha-ching!
Trading Divergences
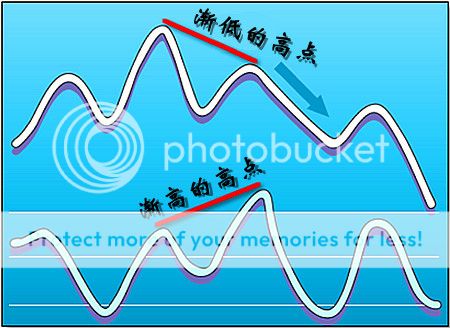
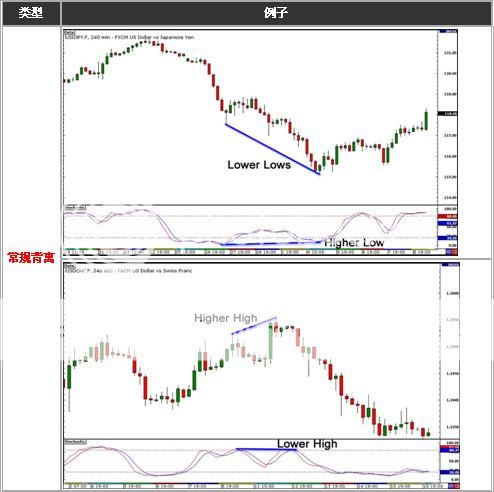
Just think “higher highs” and “lower lows”.
Price and momentum normally move hand in hand like Hansel and Gretel, Ryu and Ken, Batman and Robin, Jay Z and Beyonce, Serena and Venus Williams, salt and pepper…You get the point.

If price is making higher highs, the oscillator should also be making higher highs. If price is making lower lows, the oscillator should also be making lower lows.
If they are NOT, that means price and the oscillator are diverging from each other. And that’s why it’s called “divergence.”
Divergence trading is an awesome tool to have in your toolbox because divergences signal to you that something fishy is going on and that you should pay closer attention.
Using divergence trading can be useful in spotting a weakening trend or reversal in momentum. Sometimes you can even use it as a signal for a trend to continue!
There are TWO types of divergence:
- Regular
- Hidden
In this grade, we will teach you how to spot these divergences and how to trade them. We’ll even have a sweet surprise for you at the end.
背离交易
如果有个低风险的方法,可以在一个趋势的顶端附近做空,或是在趋势的底部附近做多,将会怎样?
如果你已经在一个多头的头寸中,并且你可以提前知道平仓的理想位置。而不是傻傻的看着你的未实现盈利,就像你已经看见的James Bond 007专属Aston Martin跑车头期款,因为你没有平仓,而被随之而来的相反趋势,在你的眼前消失了?
假若你相信一组货币对会持续下跌,但又想在一个更好的价位或者风险较小的位置做空呢?
那么你猜猜怎么着?有一个方法!那就是 背离交易!
简而言之,背离可以在通过比较价格的波动和指标的反应中看出。你可以使用使用相对强度指标(RSI)、指数平滑异同移动平均线(MACD)、随机线(KDJ)、消费者信心指数(CCI)等等。
关于背离最了不起的事,就是你可以把它们当作领先指标来使用,并且在经过一些练习之后,就不难识别出它们。
当正确地运用后,你就可以使用背离来持续获得赢利。关于背离最棒的地方是,你通常会做多在底部的附近或者是做空在顶部的附近。这样使得您交易时的风险,相对于你潜在的回报来说,是非常小的。
咔叮。。钱进袋了!!
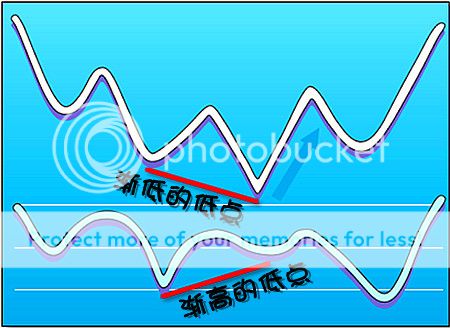
渐高的高点和渐低的低点
试想一下“渐高的高点“和“渐低的低点”。
价格的波动和趋势的动量通常手牵手一起移动,就像是奇幻森林历险记中的Hansel和Gretel、正义联盟的蝙蝠侠和罗宾、网球明星姐妹花大威小威、盐和胡椒。。这样你明白了吧!
如果价格正在形成 更高的高点,那么震荡指标也应该形成 更高的高点。如果价格正在形成更低的低点,那么震荡指标也应该形成更低的低点。
如果它们形成的不一样,这就意味着价格和震荡指标双方正背对着分开。这就是为什么称作“背离”的原因。
背离交易法是你工具箱中一件很出色的工具,因为背离会提醒你,接下来的波动可能会变卦,所以你应该多加注意。
在辨认一个趋势的减弱或动量正在反转时,使用背离交易法是非常有用的。有些时候你也可以把它的信号,当做辨认趋势是否持续来使用!
背离有两种类型:
1. 正常背离
2. 隐藏背离
在这一阶段中,我们将告诉您怎样识别这些背离,并且教你怎么利用它来交易。在这阶段结束时,我们还将给您一个甜蜜的惊喜。
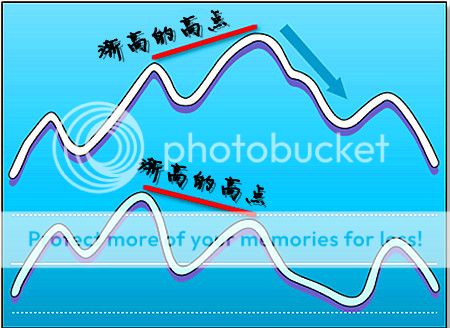
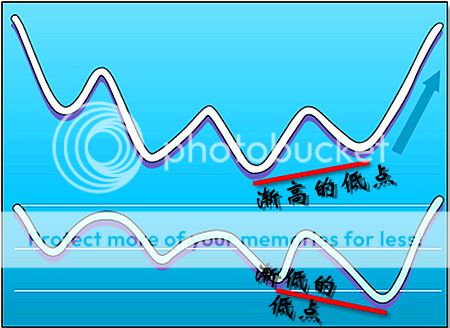
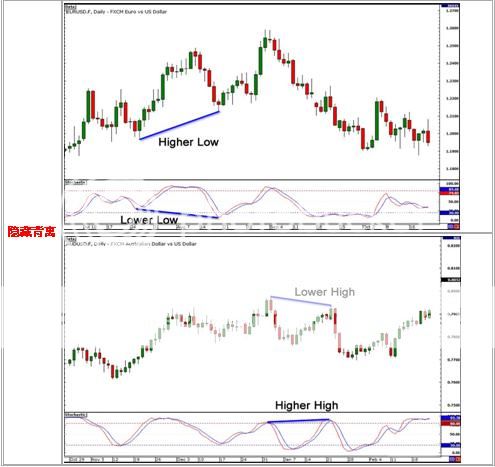
Regular Divergence
A regular divergence is used as a possible sign for a trend reversal.
If price is making lower lows (LL), but the oscillator is making higher lows (HL), this is considered to be regular bullish divergence.
This normally occurs at the end of a down trend. After establishing a second bottom, if the oscillator fails to make a new low, it is likely that the price will rise, as price and momentum are normally expected to move in line with each other.
Below is an image that portrays regular bullish divergence.

Now, if the price is making a higher high (HH), but the oscillator is lower high (LH), then you have regular bearish divergence.
This type of divergence can be found in an uptrend. After price makes that second high, if the oscillator makes a lower high, then you can probably expect price to reverse and drop.
In the image below, we see that price reverses after making the second top.

As you can see from the images above, the regular divergence is best used when trying to pick tops and bottoms. You are looking for an area where price will stop and reverse.
The oscillators signal to us that momentum is starting to shift and even though price has made a higher high (or lower low), chances are that it won’t be sustained.
See the regular bearish divergence at work through this GBP/USD trade handpicked by Pipcrawler!
Did you get all of that? Pretty simple eh?
Now that you’ve got a hold on regular divergence, it’s time to move and learn about the second type of divergence – hidden divergence.
Don’t worry, it’s not super concealed like the Chamber of Secrets and it’s not that tough to spot. The reason it’s called “hidden” is because it’s hiding inside the current trend.
We’ll explain more in the next section. Read on!
正常背离
一个正常背离被当作趋势反转的可能讯号来使用。
如果价格正走出一个渐低的低点 (LL),但是震荡指标却走出一个渐高的低点(HL),那么这通常被认为是正常的牛市背离。
这情况多数发生在下跌趋势的尾端。当价格完全形成第二个底部之后,如果振荡指标依然没有形成新低点的话,价格很可能会上升,因为价格的波动和动量的幅度,行动通常相互一致。
下面是一张描绘牛市背离的图片。
现在,如果价格正形成一个渐高的高点 (HH),但是震荡指标却是渐低的高点 (LH),那么你就有了正常的熊市背离。
这种类型的背离可以在上升的趋势中找到。当价格完全形成第二个高点之后,如果震荡指标却形成一个较低的高点,那么你可以期待价格反转和下跌。
在下图中,我们看到价格在形成第二个高点之后就反转了。
正如你在上图中看到的一样,在尝试寻找顶部和底部的时候,正常背离是最好的讯号。如果你在寻找一个价格将会终止和反转的位置。
震荡指标的信号告诉我们,动量正在转变中,即使价格还在形成渐高的高点(或渐低的低点),但趋势持续下去的概率不大了。
你都懂了吗?是不是相当简单?
既然你已经掌握了正常背离,是时候进一步学习第二种类型的背离—隐藏背离。
别担心,它不像哈利波特的密室那样超级隐蔽,也并不是很难识别。之所以称为“隐藏”,是因为它隐蔽在当前的趋势里面。
在下一课中,我们将进一步解释。 继续阅读吧!
Hidden Divergence
Divergences not only signal a potential trend reversal; they can also be used as a possible sign for a trend continuation. Always remember, the trend is your friend, so whenever you can get a signal that the trend will continue, then good for you!
Hidden bullish divergence happens when price is making a higher low (HL), but the oscillator is showing a lower low (LL).
This can be seen when the pair is in an uptrend. Once price makes a higher low, look and see if the oscillator does the same. If it doesn’t and makes a lower low, then we’ve got some hidden divergence in our hands.

Lastly, we’ve got hidden bearish divergence. This occurs when price makes a lower high (LH), but the oscillator is making a higher high (HH). By now you’ve probably guessed that this occurs in a downtrend. When you see hidden bearish divergence, chances are that the pair will continue to shoot lower and continue the downtrend.

Let’s recap what you’ve learned so far about hidden divergence.
If you’re a trend follower, then you should dedicate some time to spot some hidden divergence.
If you do happen to spot it, it can help you jump in the trend early.
Sounds good, yes?
Okay, now you know about both regular and hidden divergence.
We hope you got it all down pat. Keep in mind that regular divergences are possible signals for trend reversals while hidden divergences signal trend continuation.
In the next lesson we’ll show you some real-world examples of when divergences existed and how you could have traded them.
隐藏背离
背离不仅预示着潜在的趋势反转;它们也可以用来当做趋势持续的讯号。永远记得,趋势是你的朋友,所以,无论你什么时候得到趋势将持续的讯号,这都会有利于你!
隐藏的牛市背离产生在,当价格的出现一个渐高的低点 (HL),而振荡指标却显示一个渐低的低点 (LL)。
这情况可以在一个上升趋势的货币对发现。一旦价格出现渐高的低点(HL),查看振荡指标是否出现同样的现象。如果它没有出现相同的现象(HL),反而是一个渐低的低点(LL),那么我们手上就有了个隐藏的背离。
最后,我们了解一下隐藏的熊市背离。这种情况发生在价格出现一个渐低的高点时候 (LH),而震荡指标却出现了渐高的高点 (HH)。现在,你肯定猜到这种情况是发生在下跌趋势中。当你看到隐藏的熊市背离时,货币对很可能将继续走低并且继续下跌的趋势。
让我们回顾一下到目前为止,你所学到的关于隐藏背离的知识。
假若你是个趋势追随者,那么你应该花点时间去注意一些隐藏背离。
如果你碰巧发现它了,它可以帮你较早的跳入趋势中。
听起来不错,是吗?
好的,现在您认识了正常背离和隐藏背离。
我们希望您都了解并记住了。记得,正常背离就是趋势反转的可能讯号,而隐藏背离是趋势持续的讯号。
在下一课中,我们将展示给你一些背离出现的真实例子,和你应该怎样使用它们来交易。
How To Trade Divergences
Now it’s time to put those Jedi divergence mind tricks to work and force the markets to give you some pips!
Here we’ll show you some examples of when there was divergence between price and oscillator movements.
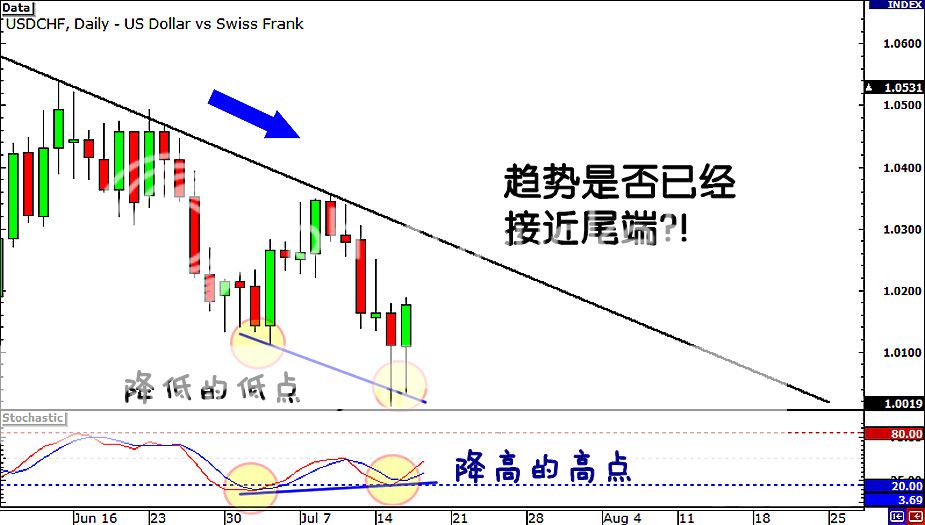
First up, let’s take a look at regular divergence. Below is a daily chart of USD/CHF.

We can see from the falling trend line that USD/CHF has been in a downtrend. However, there are signs that the downtrend will be coming to an end.
While price has registered lower lows, the stochastic (our indicator of choice) is showing a higher low.
Something smells fishy here. Is the reversal coming to an end? Is it time to buy this sucker?

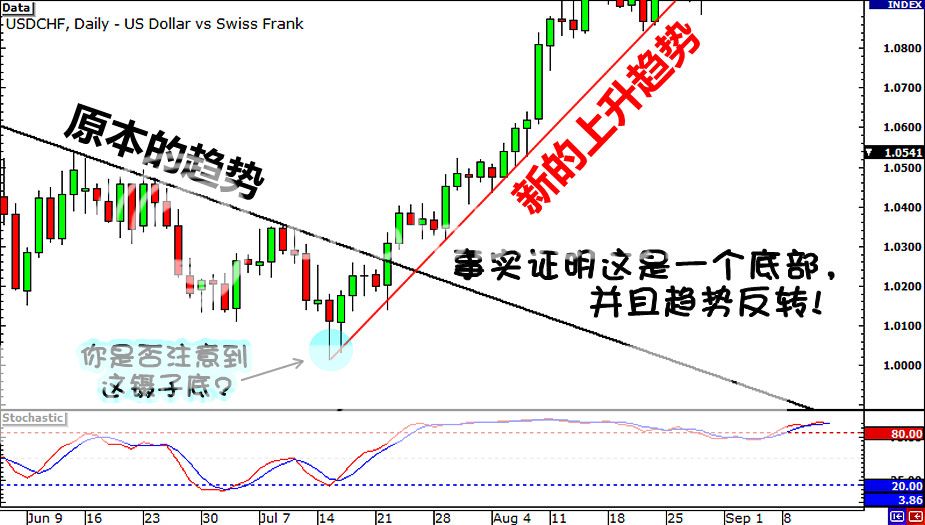
If you had answered yes to that last question, then you would have found yourself in the middle of the Caribbean, soaking up margaritas, as you would have been knee deep in your pip winnings!
It turns out that the divergence between the stochastic and price action was a good signal to buy. Price broke through the falling trend line and formed a new uptrend. If you had bought near the bottom, you could have made more than a thousand pips, as the pair continued to shoot even higher in the following months.
Now can you see why it rocks to get in on the trend early?!
Before we move on, did you notice the tweezer bottoms that formed on the second low?
Keep an eye out for other clues that a reversal is in place. This will give you more confirmation that a trend is coming to an end, giving you even more reason to believe in the power of divergences!
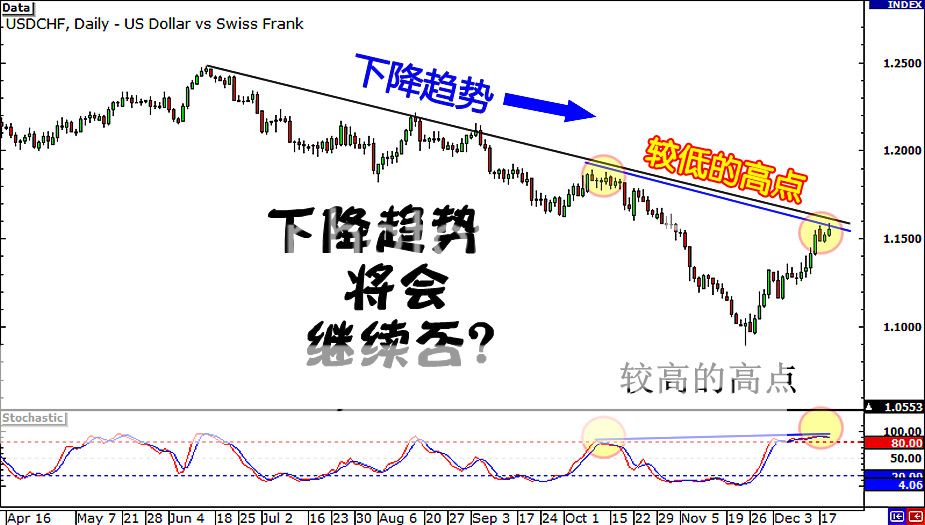
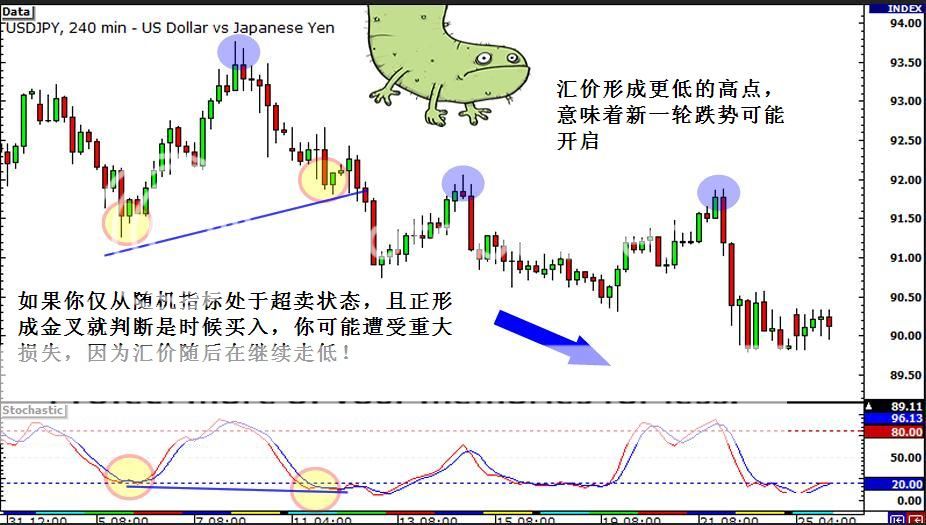
Next, let’s take a look at an example of some hidden divergence. Once again, let’s hop on to the daily chart of USD/CHF.

Here we see that the pair has been in a downtrend. Notice how price has formed a lower high but the stochastic is printing higher highs.
According to our notes, this is hidden bearish divergence! Hmmm, what should we do? Time to get back in the trend?
Well, if you ain’t sure, you can sit back and watch on the sidelines first.

If you decided to sit that one out, you might be as bald as Professor Xavier because you pulled out all your hair.
Why?
Well the trend continued!
Price bounced from the trend line and eventually dropped almost 2,000 pips!
Imagine if you had spotted the divergence and seen that as a potential signal for a continuation of the trend?
Not only would you be sipping those margaritas in the Caribbean, you’d have your own pimpin’ yacht to boot!
如何使用背离来交易
现在,是时候把这些绝地武士的心灵技巧-背离,运用到实际交易中去,并且迫使原力市场给你一些点数吧!
在这里,我们会为你展示一些,价格和震荡指标之间,出现背离的例子。
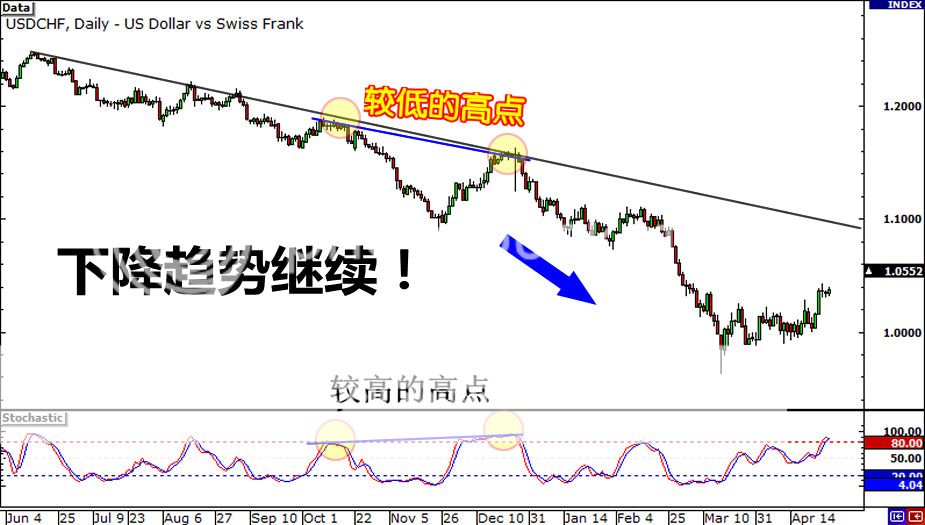
首先,让我们看一下正常背离。以下是美元/瑞郎的日图。
我们通过下降的趋势线,可以看出美元/瑞郎,已经处于下跌的趋势中。然而,已经有讯号表明,下跌的趋势已经将接近尾声了。
就在价格已经出现渐低的低点时,随机震荡指标(我们选用的指标)却显示着一个渐高的低点。
是否闻到一些鱼腥味?这儿有大鱼可以抓没?趋势是否接近尾端,即将反转了?现在是进场做多的好时机没?
如果你对上题,回答“是”的话。那么你就会发现,自己已经在阳光明媚,海面水晶般清澈的Caribbean海中了,沉浸在咸咸甜甜的margaritas鸡尾酒中,就如同你已经深深的,掉进了你赢得的点堆里!
这表明,随机指标和价格走势之间的背离,是一个很好的下单信号。价格突破了下跌的趋势线,并形成了一个新的上升趋势。如果你已经在底部附近买进的话,那么你可能会赚得千多个点,因为该货币对在接下来的几个月里,继续升得更高。
现在你明白了,为什么背离会标志着,较早进入趋势的原因了吧?
在我们继续之前,你有没有注意到第二个低点上,蜡烛图同时形了镊子平底的反转形态?
在可能反转的地方,密切观察其他的蛛丝马迹。这会给你更多的确认,证实该趋势即将接近结束,让你有更多的理由去相信背离的力量!
接下来,让我们来看看一些隐藏背离的例子。再一次,让我们又跳上美元/瑞郎的日线图。
这里,我们可以看到该货币对,正处于下跌趋势中。注意价格是如何形成一个较低的高点,可是随机指标却描出了较高的高点。
根据我们之前的说明,这是一个隐藏的熊市背离!嗯嗯嗯,我们应该怎么做?趋势会继续吗?
好吧,既然你不确定,那么你可以不采取行动,并在旁继续观察先。
如果你真的决定一直静静的坐在一旁,那么你可能已经变成X-Men里的,Xavier教授一样的秃头,因为所有的头发已经被你给扯光了。
为什么?
因为趋势仍在继续!
价格从趋势线反弹后,最终跌了差不多2,000点!
试想一下,如果你识别出该背离,而且已经将其看成是趋势持续的潜在信号?
那么你不仅会在Caribbean海中,啜饮着margaritas,而且你还有了一艘像pimpin’MV里的豪华游艇!
How to Avoid Entering Too Early When Trading Divergences
While using divergences is a great tool to have in your trading toolbox, there are times when you might enter too early because you didn’t wait for more confirmation. Below are a couple of tricks that you can make use of so that you have more confirmation that the divergence will work out in your favor.
Wait for an indicator crossover.
This ain’t so much a trick as it is a rule. Just wait for a crossover of the momentum indicator. This would indicate a potential shift in momentum from buying to selling or vice versa. The main reasoning behind this is that you are waiting for top or bottom and these can’t be formed unless a crossover is made!

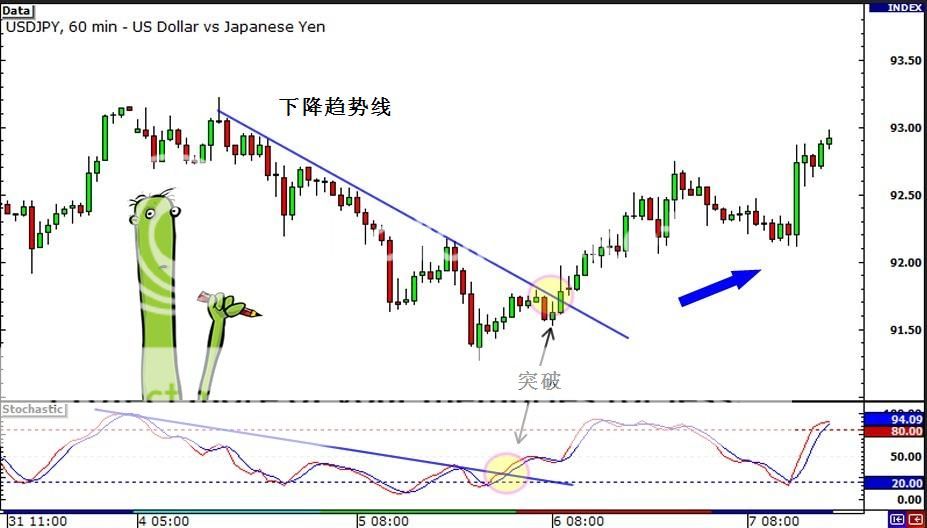
In the chart above, the pair showed lower highs while the stochastic already made higher highs. Now that’s a bearish divergence there and it sure is tempting to short right away.
But, you know what they say, patience is a virtue. It’d be better to wait for the stochastic to make a downward crossover as confirmation that the pair is indeed headed down.

A couple of candles later, the stochastic did make that crossover. Playing that bearish divergence would’ve been pip-tastic!
What’s the main point here? Just be patient! Don’t try to jump the gun because you don’t quite know when momentum will shift! If you aren’t patient, you might just get burned as one side keeps dominating!
Wait for indicator to move out of overbought/oversold territory.
Another trick would be to wait for momentum highs and lows to hit overbought and oversold conditions, and wait for the indicator to move out of these conditions.
The reason for doing this is similar to that of waiting for a crossover – you really don’t have any idea when momentum will begin to shift.
Let’s say you’re looking at a chart and you notice that the stochastic has formed a new low while price hasn’t.

You may think that it’s time to buy because the indicator is showing oversold conditions and divergence has formed. However, selling pressure may remain strong and price continues to fall and make a new low.
You would have been pretty bummed out as trend didn’t continue. In fact, a new downtrend is probably in place as the pair is now forming lower highs. And if you were stubborn, you might have missed out on this down move too.
If you had waited patiently for more confirmation that the divergence had formed, then you could have avoided losing and realized that a new trend was developing.
Draw trend lines on the momentum indicators themselves.
This might sound a little ridiculous since you would normally draw trend lines only on price action. But this is a nifty lil’ trick that we wanna share with you. After all, it doesn’t hurt to have another weapon in the holster right? You never know when you might use it!
This trick can be particularly useful especially when looking for reversals or breaks from a trend. When you see that price is respecting a trend line, try drawing a similar trend line on your indicator.

You may notice that the indicator will also respect the trend line. If you see both price action and the momentum indicator break their respective trend lines, it could signal a shift in power from buyers to sellers (or vice versa) and that the trend could be changing. Oh yeah! Break it down like a Michael Jackson video!
背离的进一步确认
尽管背离是一个相当有效的交易工具,但是有些时候,你可能过早的入场,因为你并未等到更多信息的确认。在本课,我们将教给大家提高利用背离交易胜算的一些方法,以便获得更多的信息确定背离的有效性。
等待交叉出现
我们这里所说的方法并非是规则。交易者只是需要等到动能指标出现交叉后再选择入场。动能指标的交叉意味着汇价动能可能由超买转弱,或由超卖转强。等待动能指标交叉后入场的主要原因在于,交易者需要等待汇价顶部或底部的形成,除非动能指标出现交叉,否则顶部或底部的形成可能性不大。

如上图所示,汇价所形成的高点低于前高,不过随机指标已经创出新高。你可能认为,这是空头背离形态,应该马上选择做空。
但是,我们刚刚已经说过,耐心是个人美德的一种表现。因此,我们最好等到随机指标出现死叉后,方能证实汇价确实将走低。

在数根蜡烛线形成过后,随机指标确实形成死叉,这时选择进行空头背离交易将更为保险。
这里的要点是什么呢?很简单,保持耐心!不要急于开火,因为对于汇价动能什么时候出现转向并不十分确定。如果你没有足够的耐心,当汇价继续沿着之前走势波动时,你可能会被自己射中。
等待指标脱离超买/超卖区域
另一种方法是等到动能指标进入超买区域或超卖区域,并等到指标脱离超买或超卖状况后入场。
选择使用本方法的原因和上述方法的原因一样——因为你并不知道什么时候动能将会开始转向。
比如说,你正在观察技术图形,你注意到随机指标已经创出新低,但是价格却尚未如此。
你可能认为,是时候选在买入,因为随机指标显示汇价处于超卖状态,且背离形态已经形成。但是,卖盘压力可能仍将强劲,且汇价将会继续下跌,并进一步创出新低。
如果你选在买入的话,现在你可能是一副颓废样子,因为汇价并未出现反弹。事实上,汇价不久可能开启一轮新的下跌趋势,因为汇价正在形成更低的高点。同时,如果你还是玩不固化,你可能再次错过新一轮下跌趋势机会。
如果你有足够的耐心,在搜集到更多的信息确认背离形态的形成后,你可能已经避免了不必要的损失,且能够认识到新趋势正在形成。
判断动能指标趋势线突破
这听上去可能有些滑稽,因为我们一般都只是在汇价走势图上画趋势线,不过,这一方法确实管用,在这里,我们也会和大家一起分享。
毕竟,在你的外汇交易工具箱里面增添一件新的武器总不是什么坏事。你永远不会知道,你什么时候可能使用它!
这一方法在我们寻找潜在的反转行情或趋势突破行情时尤其有效。如果你看到汇价正测试某一条趋势线,请尝试着在相应动能指标图形上画出类似的趋势线。
你可能已经注意到了,随机指标也会测试趋势线阻力。如果你看到汇价和动能指标双双突破趋势线,这可能显示市场主导力量由买方转向卖方,或由卖方转向买方,而趋势也可能出现改变。
9 Rules for Trading Divergences
Before you head out there and start looking for potential divergences, here are nine cool rules for trading divergences.
Learn ‘em, memorize ‘em (or keep coming back here), apply ‘em to help you make better trading decisions. Ignore them and go broke.
1. Make sure your glasses are clean
In order for divergence to exist, price must have either formed one of the following:
- Higher high than the previous high
- Lower low than the previous low
- Double top
- Double bottom
Don’t even bother looking at an indicator unless ONE of these four price scenarios have occurred. If not, you ain’t trading a divergence, buddy. You’re just imagining things. Immediately go see your optometrist and get some new glasses.


2. Draw lines on successive tops and bottoms
Okay now that you got some action (recent price action that is), look at it. Remember, you’ll only see one of four things: a higher high, a flat high, a lower low, or a flat low.
Now draw a line backward from that high or low to the previous high or low. It HAS to be on successive major tops/bottom. If you see any little bumps or dips between the two major highs/lows, do what you do when your significant other shouts at you – ignore it.
3. Do Tha Right Thang – Connect TOPS and BOTTOMS only
Once you see two swing highs are established, you connect the TOPS. If two lows are made, you connect the BOTTOMS.
Don’t make the mistake of trying to draw a line at the bottom when you see two higher highs. It sounds dumb but really, peeps regularly get confused.

4. Eyes on the Price
So you’ve connected either two tops or two bottoms with a trend line. Now look at your preferred indicator and compare it to price action. Whichever indicator you use, remember you are comparing its TOPS or BOTTOMS. Some indicators such as MACD or Stochastic have multiple lines all up on each other like teenagers with raging hormones. Don’t worry about what these kids are doing.

5. Be Fly like Pip Diddy
If you draw a line connecting two highs on price, you MUST draw a line connecting the two highs on the indicator as well. Ditto for lows also. If you draw a line connecting two lows on price, you MUST draw a line connecting two lows on the indicator. They have to match!


6. Keep in Line
The highs or lows you identify on the indicator MUST be the ones that line up VERTICALLY with the price highs or lows. It’s just like picking out what to wear to the club – you gotta be fly and matchin’ yo!

7. Ridin’ the slopes
Divergence only exists if the SLOPE of the line connecting the indicator tops/bottoms DIFFERS from the SLOPE of the line connection price tops/bottoms. The slope must either be: Ascending (rising) Descending (falling) Flat (flat)

8. If the ship has sailed, catch the next one
If you spot divergence but the price has already reversed and moved in one direction for some time, the divergence should be considered played out. You missed the boat this time. All you can do now is wait for another swing high/low to form and start your divergence search over.

9. Take a step back
Divergence signals tend to be more accurate on the longer time frames. You get less false signals. This means fewer trades but if you structure your trade well, then your profit potential can be huge. Divergences on shorter time frames will occur more frequently but are less reliable.
We advise only look for divergences on 1-hour charts or longer. Other traders use 15-minute charts or even faster. On those time frames, there’s just too much noise for our taste so we just stay away.
So there you have it kiddos – 9 rules you MUST follow if you want to seriously consider trading using divergences. Trust us, you don’t wanna be ignoring these rules. Your account will take more hits than BabyPips.com’s Facebook fan page.
Follow these rules, and you will dramatically increase the chances of a divergence setup leading to a profitable trade.
Here’s an example of how a bearish divergence failed. Can you figure out which of these 9 rules Cyclopip broke?
Now go scan the charts and see if you can spot some divergences that happened in the past as a great way to begin getting your divergence skills up to par!
背离交易的9条规则
在你寻找潜在的背离形态之前,你需要牢牢记住以下9条有关背离交易的规则。
我们需要学习它们、记住它们、并利用它们以帮助你更好的做出交易决定。而忽视它们的存在,可能导致个人账户的爆仓。
1. 确保你的眼镜是干净的
为了确定背离的形成,价格需要形成以下几种形态中的一种
● 高点高于之前高点
● 低点低于之前低点
● 双顶
● 双底
在以上四种情形出现之前,不要急于观察相关的技术指标。如果价格尚未形成上述四种形态中的任何一种,你最好不要进行背离交易。如果你坚持要这么做,你只是在凭空想象而已。建议你去拜访一下你的验光师,让他跟你重新配副眼镜吧。

2. 画线连接连续的顶部或底部
密切观察汇价最近的走势。记住,你将只会看到四种情形:一个更高的高点、一个和之前高点相同的高点、一个更低的低点,或一个和之前低点相同的低点。
现在,我们要做的就是,自新高或新低画一条直线,连接前高或前低。价格所形成的形态必须是连续的主要顶部或底部。如果你看到的只是两个主要高点之前很小的波峰,或两个低点之前很小的低谷,你要做的是坚持自己的主见,当有人吵你大喊时,最好是忽视它们的意见。
3. 做正确的事情——只连接连续的顶部或底部
一旦你看到价格形成两个波段高点,你用直线连接上述顶部;如果你看到价格形成两个波段低点,请用直线连接上述底部。
当你看到价格形成更高的高点时,不要尝试在底部画连接低点的直线。
4. 关注价格走势
你已经用直线连接了两个连续的顶部或底部,现在,你可以观察你惯常用的指标并将它们和价格走势情况进行对比。无论你用什么指标,请记住,你所比较的是它的顶部或底部。一些指标,比如MACD指标或随机指标,可以画出多条连接高点或多条连接低点的直线,不用担心,你要做的只是关注和连接价格顶部或底部直线相对应的指标连线。
5. 同时画出连接价格和指标的直线
如果你画出一条连接两个高点的直线,你必须同时画出连接指标两个高点的直线。 这一做法也同样适用于低点时的情况。如果你画出一条连接两个低点的直线,你也必须同时画出连接指标两个低点的直线。

6. 价格和指标高低点保持一致
指标的高点或低点必须和价格的高点或低点排列在同一条垂直线上。

7. 观察倾斜线走势
背离只会出现在连接指标顶部/底部的斜线和连接价格顶部/底部的斜线走势不一致的情况下。倾斜线必须是下列三种情况中的一种:上升线、下降线或水平线。

8. 一旦错过,等待下一次机会
如果你描绘出了背离形态,但是价格走势此时却已经出现转向,并朝着逆转后的方向运行了一旦时间,那么,这次你已经错过了背离交易的时机。你所能够做的全部只是等待另一次区间高点/低点的形成,并再次开始你寻找背离的旅行。

9. 选择长时间范围进行背离交易
时间范围越长,图形所发出的背离信号越准确。这意味着你做的交易手数会更少,但是,如果你很好的构建起你的交易系统,你的获利将是十分巨大的。短时间范围内背离出现得更为频繁,但是可信度也更低。
我们只建议投资者在1小时图或更长时间范围图形上进行背离交易。其他交易者使用15分钟图甚至更短时间范围图形进行背离交易。在更短时间范围进行背离交易,我们会遇到过多的噪音,因此,我们最好远离在过短时间范围内进行背离交易。
如果你在认真考虑利用背离形态进行交易,上述9条规则你必须脑记于胸。请相信我们,不要忽视了这9条规则的存在。
如果你遵循这些规则,你建立起完备的背离交易系统获取可观收益的几率将会大增。
Divergence Cheat Sheet
Let’s review!
There are two types of divergences:
- Regular divergence
- Hidden divergence
Each type of divergence will contain either a bullish bias or a bearish bias.
Since you’ve all be studying hard and not been cutting class, we’ve decided to help y’all out (cause we’re nice like that) by giving you a cheat sheet to help you spot regular and hidden divergences quickly.
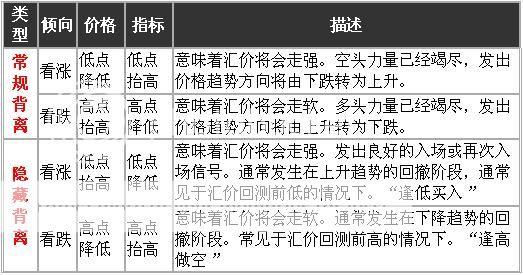
| Type | Bias | Price | Oscillator | Description | Example |
|---|---|---|---|---|---|
| Regular | Bullish | Lower Low | Higher Low | Indicates underlying strength. Bears are exhausted.Warning of possible trend direction change from downtrend to uptrend. | , Oscillator (HL)") |
| Bearish | Higher High | Lower High | Indicates underlying weakness. Bulls are exhausted.Warning of possible trend direction change from uptrend to downtrend. | , Oscillator (LH)") | |
| Hidden | Bullish | Higher Low | Lower Low | Indicates underlying strength. Good entry or re-entry. Occurs during retracements in an uptrend. Nice to see during price retest of previous lows. “Buy the dips” | , Oscillator (LL)") |
| Bearish | Lower High | Higher High | Indicates underlying weakness. Found during retracements in a downtrend. Nice to see during price retests of previous highs. “Sell the rallies” | , Oscillator (HH)") |
Whew! That’s quite a lot to remember, isn’t it? We’ll give you two options:
- You can write this all down in your palm and look back on it while trading. If you’re the type who gets sweaty palms when you’re nervous, we wouldn’t recommend this.
- You can simply bookmark this page and just revisit it when you mix up those higher lows, lower highs, lower lows, and higher highs. You don’t want to make a wild guess while coming up with a trade, do you?
背离备忘录
现在,让我们回顾一下之前所学到的内容!
背离形态有两种类型:
1. 常规背离
2. 隐藏背离
每种类型的背离要么发出看涨信号,要么发出看跌信号。
鉴于你们都在努力学习且从未翘课,在这里我们将给你一份备忘录,以帮你能够迅速识别出常规和隐藏背离。
哇,有太多内容需要记忆了,不是吗?我们将给你两种选择:
1. 你能够将它们记在手掌上,当需要温习的时候回过头来看看。但是,
如果你是哪种在紧张的时候手心容易流汗的类型,我们建议你最好不要采取这种方法。
2. 你能够将本页做一个书签,当你对这些更高的低点、更低的高点、更低的低点,
以及更高的高点感到迷惑的时候,你能够拿出来再次熟悉一遍。
你可不想在面临一项重大的交易决策时只是用我猜我猜我猜猜猜的方法来应对,是吧?
Summary Of Divergences

Please keep in mind that we use divergence as an indicator, not a signal to enter a trade!
It wouldn’t be smart to trade based solely on divergences since too many false signals are given. It’s not 100% foolproof, but when used as a setup condition and combined with additional confirmation tools, your trades have a high probability of winning with relatively low risk.
There are a bunch of ways to take advantage of those divergences.
One way is to look at trend lines or candlestick formations to confirm whether a reversal or continuation is in order.
Another way is to make use of momentum tricks by watching out for an actual crossover or waiting for the oscillator to move out of the overbought/oversold region. You can also try drawing trend lines on the oscillator too.
With these nifty tricks, you can guard yourself against false signals and filter out those that’ll be very profitable.
On the flip side, it is just as dangerous trade against this indicator.

Remember that taking no position is a trading decision in itself and it’s better to hold on to your hard-earned cash than bleed Benjamins on a shaky trade idea.
Divergences don’t appear that often, but when they do appear, it’d behoove you to pay attention.
Regular divergences can help you collect a big chunk of profit because you’re able to get in right when the trend changes.
Hidden divergences can help you ride a trade longer resulting in bigger-than-expected profits by keeping you on the correct side of a trend.
The trick is to train your eye to spot divergences when they appear AND choose the proper divergences to trade.
Just because you see a divergence, it doesn’t necessarily mean you should automatically jump in with a position. Cherry pick your setups and you’ll do well.
For more discussions on divergences, visit any of the following forum threads:
总结:背离交易

PS:背离有两种类型:常规背离和隐藏背离
请在脑子中形成这一观念,我们只是将背离作为一种指标来使用,而非是发出交易进场的信号。
单凭背离信号来进行交易非常不明智,因为背离会发出过多的虚假信号。背离信号并不能保证我们交易的100%安全,但是当我们将背离作为我们交易系统的一部分,结合其他工具来证实背离形态的有效性时,你的交易胜算将大为提升,而面临的风险也相对要小很多。
结合其他工具来确定背离的方法有很多。
一种方法是看趋势线或蜡烛图形态以判断,汇价是否会出现反转或将延续之前走势。
另一种方法是看等待震荡指标出现交叉形态,或等到震荡指标脱离超买或超卖区域。你同时能够在震荡指标图形上画趋势线以判断形态突破的有效性。
通过上述有效的方法,你能够让自己免受虚假信号的欺骗,并过滤掉这些无效信息,进而实现较高的盈利目标。
从另一方面讲,违背背离信号进行交易也是非常危险的。

如果你不大确定交易方向,最好选择观望。
记住,不持有任何头寸也是一种交易决定,在你没有十足把握的情况下,持有你辛苦赚来的现金比进行风险性极高的交易导致自己失血过多要高明得多。
背离并非经常出现,但是,当它们出现时,你最好保持关注。
常规背离能够帮助你获得非常高的收益,因为当趋势改变时,你能够判断出正确的方向。
隐藏背离能够帮助你继续站在市场正确的方向一边,进而实现高于预期的盈利水平。
你需要练就一双辨别背离形态的火眼金睛,当出现背离形态时,你能够准确的判断出背离的类型,进而选择合适的背离模型进行交易。
单凭发现背离形态这一点,并非意味着你应该立马入场进行交易。进一步确认形态的有效性,你将做得更稳当。