How to Trade Breakouts
What are breakouts and how can I take advantage of them?

Unlike the breakouts you might have had as a teenager, a breakout in the trading world is a little different!
A breakout occurs when the price “breaks out” (get it?) of some kind of consolidation or trading range.
A breakout can also occur when a specific price level is breached such as support and resistance levels, pivot points, Fibonacci levels, etc.
With breakout trades, the goal is to enter the market right when the price makes a breakout and then continue to ride the trade until volatility dies down.
Volatility, Not Volume

You’ll notice that unlike trading stocks or futures, there is no way for you to see the volume of trades made in the forex market.
With stock or future trades, volume is essential for making good breakout trades so not having this data available in the forex leaves us at a disadvantage.
Because of this disadvantage, we have to rely not only on good risk management, but also on certain criteria in order to position ourselves for a good potential breakout.
If there is large price movement within a short amount of time then volatility would be considered high.
On the other hand, if there is relatively little movement in a short period of time then volatility would be considered low.
While it’s tempting to get in the market when it is moving faster than a speeding bullet, you will often find yourself more stressed and anxious; making bad decisions as your money goes in and then goes right back out.
This high volatility is what attracts a lot of forex traders, but it’s this same volatility that kills a lot of them as well.
The goal here is to use volatility to your advantage.
Rather than following the herd and trying to jump in when the market is super volatile, it would be better to look for currency pairs with volatility that is very low.
This way, you can position yourself and be ready for when a breakout occurs and volatility skyrockets!
突破交易
什么是突破,我该如何利用突破行情进行交易?
和你在青春期挤青春痘所经历的“突破”不同,在交易世界中我们所说的突破是另外一回事。
当价格摆脱某一横盘整理态势,或脱离区间整理状态,突破行情则以后可能出现。
突破行情也可能见于价格穿越某一特定价位,比如支撑和阻力位、枢纽点、斐波那契水平位等。
进行突破行情交易,我们的目标在于价格发生突破行情的那一刻便进入市场,并跟随市场运动的方向而动,直到市场波动性消失殆尽。
波动性,而非交易量

你会注意到,和进行股票交易和期货交易不同,你无法获悉外汇市场的交易量。
对于股票或期货交易来说,交易量对于判断市场的突破行情非常有用,因此,进行外汇交易的不足之处也在于,我们难以利用交易量数据。
基于外汇交易的这一不足之处,我们所依赖的不仅仅是好的风险管理方法,同时也需要以来一些准则,以利于我们在潜在突破行情出现时进行头寸调整。
如果在短期内出现大的价格波动,那么市场波动性将非常高。
从另一方面来说,如果短期内价格波动相对较小,那么市场波动性也较低。
尽管当价格波动的速度超过子弹时进入市场极具诱惑,但是你也将发现,你会变得更加的焦虑,且压力也更大,因为,如果你在此时作出错误的决策,你将损失大把的资金。
较高的市场波动性是吸引大多数交易者的地方,但是也是这种高波动性,也让众多的交易者血本无归。
我们的目的是利用市场的波动性获得稳定的盈利。
与其跟随市场主流,并在市场出现巨大波动性时入场,不如多关注一下那些波动性较低的货币对。
在这一情况下,你可以提前安排自己的头寸,当突破行情出现,市场出现大幅波动时,你可以提前做好准备。
How to Measure Volatility
Volatility is something that we can use when looking for good breakout trade opportunities.
Volatility measures the overall price fluctuations over a certain time and this information can be used to detect potential breakouts.
There are a few indicators that can help you gauge a pair’s current volatility. Using these indicators can help you tremendously when looking for breakout opportunities.
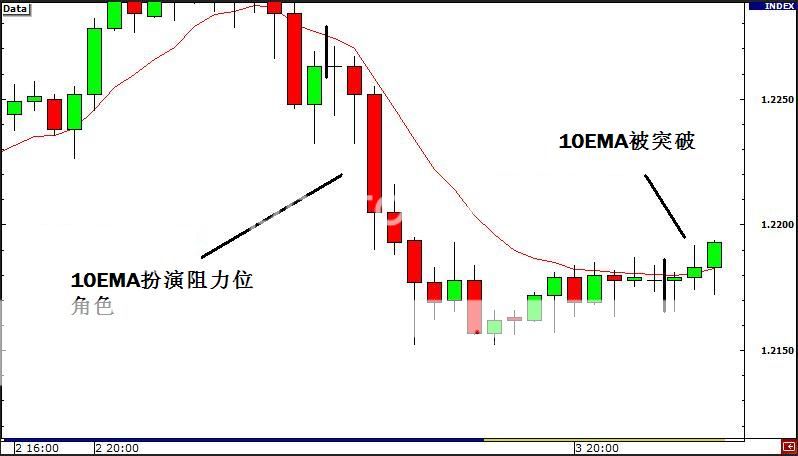
1. Moving Average
Moving averages are probably the most common indicator used by forex traders and although it is a simple tool, it provides invaluable data.
Simply put, moving averages measures the average movement of the market for an X amount of time, where X is whatever you want it to be.
For example, if you applied a 20 SMA to a daily chart, it would show you the average movement for the past 20 days.
There are other types of moving averages such as exponential and weighted, but for the purpose of this lesson we won’t go too much in detail on them.
For more information on moving averages or if you just need to refresh yourself on them, check out our lesson on moving averages.

2. Bollinger Bands
Bollinger bands are excellent tools for measuring volatility because that is exactly what it was designed to do.
Bollinger bands are basically 2 lines that are plotted 2 standard deviations above and below a moving average for an X amount of time, where X is whatever you want it to be.
So if we set it at 20, we would have a 20 SMA and two other lines. One line would be plotted +2 standard deviations above it and the other line would be plotted -2 standard deviations below.
When the bands contract, it tells us that volatility is low.
When the bands widen, it tells us that volatility is high.
For a more thorough explanation, check out our Bollinger bands lesson.

3. Average True Range (ATR)
Last on the list is the ATR.
The ATR is an excellent tool for measuring volatility because it tells us the average trading range of the market for X amount of time, where X is whatever you want it to be.
So if you set ATR to 20 on a daily chart, it would show you the average trading range for the past 20 days.

When ATR is falling, it is an indication that volatility is decreasing. When ATR is rising, it is an indication that volatility has been on the rise.
波动的测量方法
当我们在寻找良好的突破交易机会时,我们能够利用波动性。
波动性衡量的是总体价格在一段时间以内的波动情况,这一信息能够用来侦测潜在的突破行情。
有一些指标能够帮助我们来测量汇价的当前波动性。当我们在寻找突破机会时,利用这些指标将在很大程度上帮助我们。
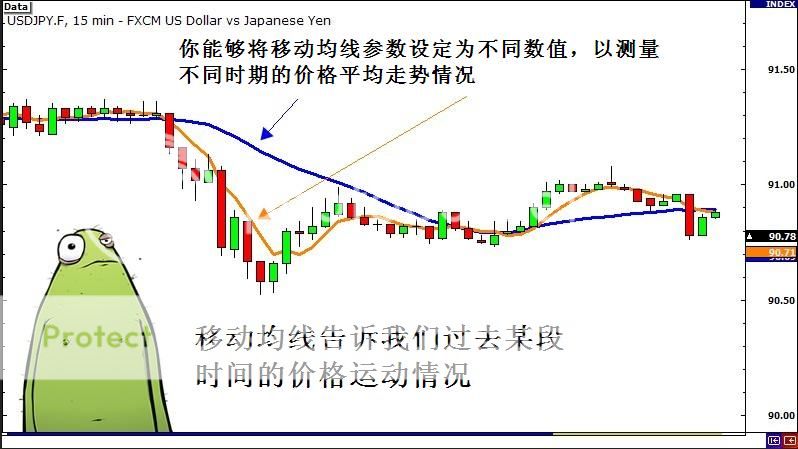
1. 移动均线
移动均线很可能是交易者使用最为普通的经济指标,尽管该指标使用简单,但是所提供的信息却是无价的。
简单来说,移动均线测量的是在X段时间内市场的平均运动情况,X能够由你自己的偏好任意设定。
比如说,如果你偏好在日图中使用20 SMA,那么,该均线显示的就是过去20天的价格平均走势情况。
当然,也有其他类别的移动均线,比如指数加权移动均线,不过本课的目的不是对这些细节做更细致的讨论。
如果你要了解更多有关移动均线的信息,或如果你仅仅需要对这些知识做一个回顾,可以回到我们的小学四年级课程进行学习。
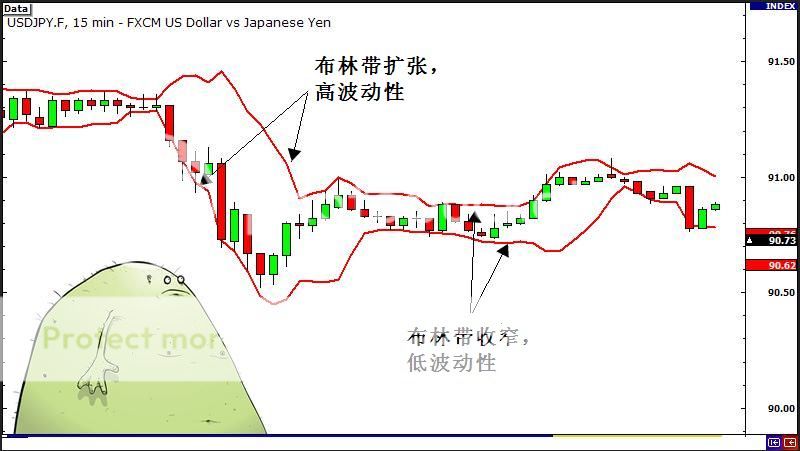
2. 布林带
布林带是测量市场波动性的非常优秀工具,因为这也正是布林带的强项。
布林带通常由2条标准差为2的线组成,这两条线分布在X段时间内移动均线的上方和下方,X也由你自己设置。
比如说,如果你将X值设为20,那么你将得到20SMA和其他两条线。一条是标准差为+2的线,另一条是标准差为-2的线。
当布林带收缩时,则表明波动性降低;
当布林带扩张时,则表明波动性提高。
3. ATR指标
最后一种可用指标是真实平均区域指标(ATR)。
ATR指标也是测量波动性非常有效的指标,因为它告诉我们过去X段时间内的平均波动区间,X也由我们的喜好设定。
比如说,如果你在日图上设定ATR指标为20,那么它显示的就是在过去20天的平均交易区间情况。
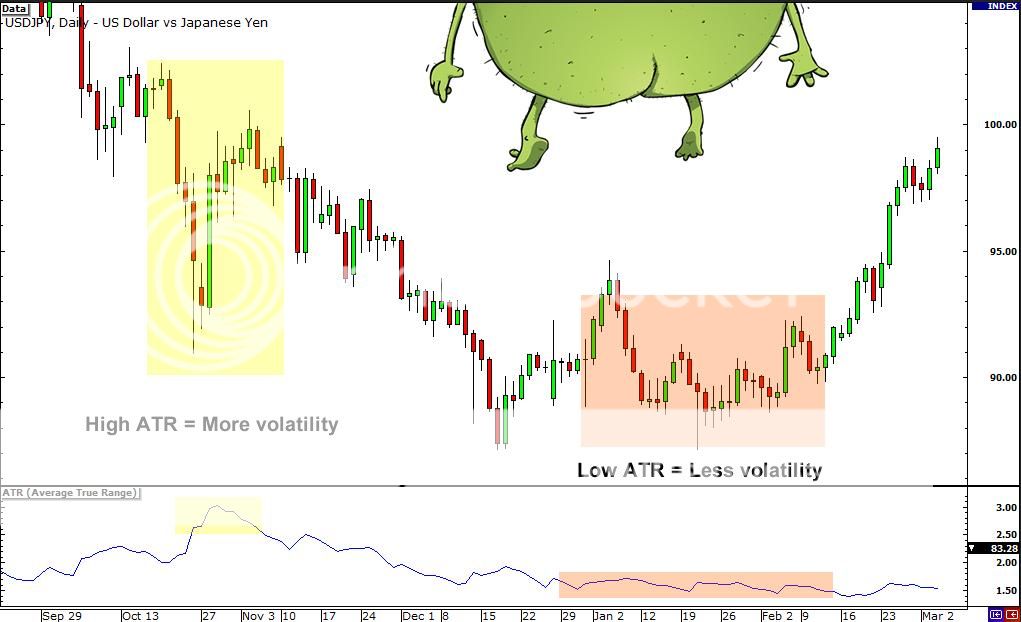
当ATR下降时,它表明市场波动性在降低,而当ATR上升时,则表明波动性在增强。
Types of Breakouts
When trading breakouts in forex, it is important to realize that there are two main types:
- Continuation breakouts
- Reversal breakouts
Knowing what type of breakout you are seeing will help you make sense of what is actually happening in the big picture of the market.
Breakouts are significant because they indicate a change in the supply and demand of the currency pair you are trading. This change in sentiment can cause extensive moves that provide excellent opportunities for you to grab some pips.
Continuation Breakouts
Sometimes when there is an extensive move in one direction the market will often take a breather. This occurs when buyers and sellers pause to see what they should do next. As a result, you will see a period of range-bound movement called consolidation.

If traders decide that the initial trend was the right decision, and continue to push the price in the same direction, the result is a continuation breakout. Just think of it as a “continuation” of the initial trend…. You’re so smart!

Reversal Breakouts
Reversal breakouts start off the same way as continuation breakouts in the fact that after a long trend, there tends to be a pause or consolidation.

The only difference is that after this consolidation, forex traders decide that the trend is exhausted and push the price in the opposite or “reverse” direction. As a result, you have what is called a “reversal breakout”. You catch on quick!

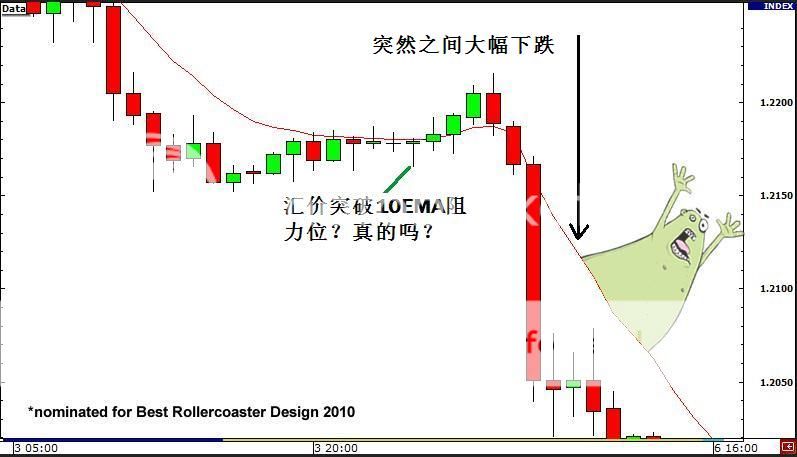
False Breakouts
Now we know by now you are super excited to start trading breakouts (please tell us you haven’t already started trading!) but you also have to be careful. Just like Lionel Messi can fake out defenders, the market can fake you out as well produce false breakouts.
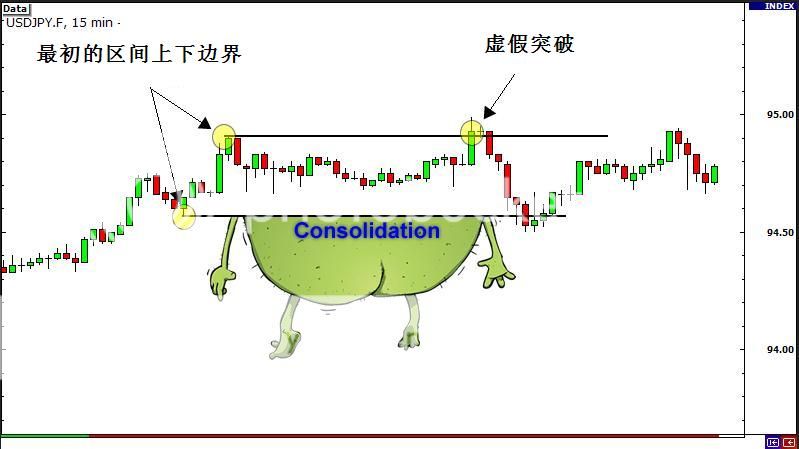
False breakouts occur when the price breaks past a certain level (support, resistance, triangle, trend line, etc.) but doesn’t continue to accelerate in that direction. Instead, what you might’ve seen was a short spike followed by the price moving back into its trading range.

A good way to enter on a breakout is to wait until the price retraces back to the original breakout level and then wait to see if it bounces back to create a new high or low (depending on which direction you are trading).

Another way to combat fake outs is by not taking the first breakout you see. By waiting to see if the price will continue to move in your intended direction, you give yourself a better chance of taking a profitable trade. The downside to this is that you may miss out on some trades in which the price moves quickly without any hesitation.
Read about Pipcrawler catching a EUR/USD breakout and Happy Pip getting duped by a USD/CAD fakeout.
突破的类别
当我们进行突破行情交易之前,我们有必要知道,突破行情有两种主要类型:
1. 持续突破
2. 反转突破
对突破类别的清晰判断能够帮助你把握总体市场的真实发展状况。
突破需要引起足够重视,因为它意味着你正在交易货币对的供需正在发生改变。这种改变能够延伸货币对之前走势,并提供给你进一步获利的上好机会。
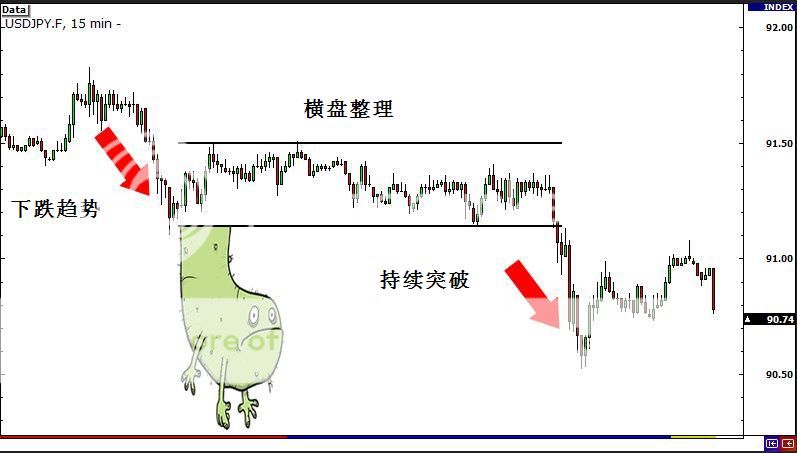
持续突破
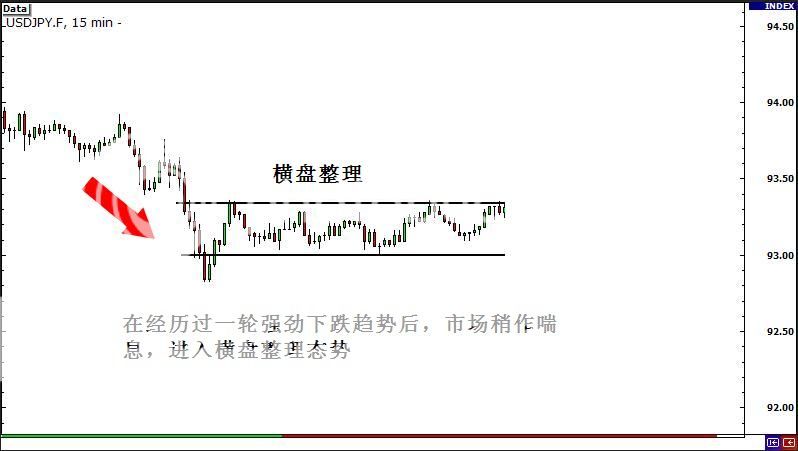
有些时候,当市场经历一段大的单边行情后,可能陷入横盘整理态势。此时,买方和卖方稍作喘息,并来判断他们下一步应该做什么。结果就是,你将看待汇价经历一段时间的横盘整理期。
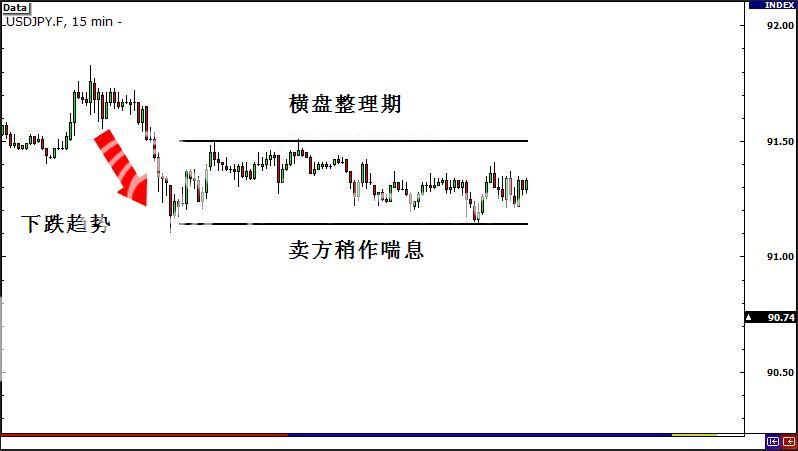
如果交易者相信,最初的趋势才是市场的正确方向,并且可能延续之前的方向运行,那么,结果就是可能出现持续突破。
反转突破
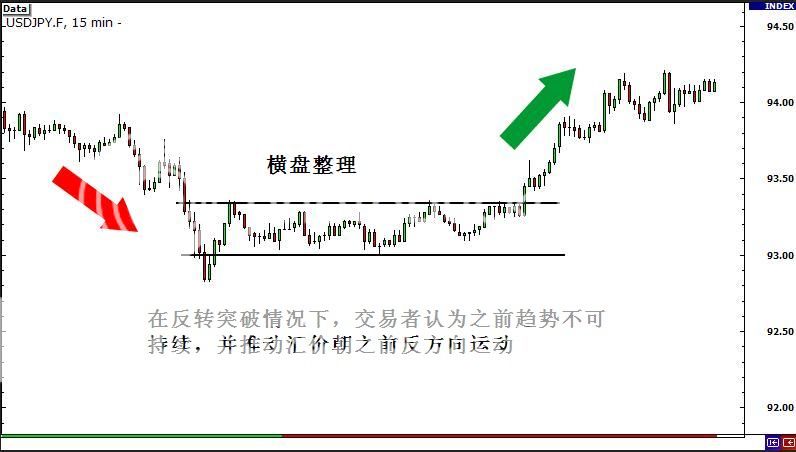
反转突破也出现在汇价经历一轮大的单边行情后,随后价格同样呈现出横盘整理格局。
唯一的不同在于,在经历一段时间的横盘整理后,交易者认为此前的单边行情趋势已经趋于终结,并推动价格朝反方向波动。结果就是,汇价呈现出反转突破格局。
假突破
现在,你可能非常想进行突破交易,但是你必须保持警惕。就像科比会做假动作欺骗防守队员一样,市场也可能欺骗你,向你发出虚假的突破信息。
当价格突破某一水平位,比如支撑位、阻力位、三角形态、趋势线等,但并未加速沿着之前突破方向波动。与此相反的是,价格随后快速反向波动,并再次进入之前交易区间。
突破交易最佳的入场时机应该是,等到价格最初突破并回撤后,判断价格的回撤是否创出新高或新低,这取决于你所交易的具体方向而定。
另一种避免假突破的方法是,在价格第一次突破时,不要入场。而是观察看,价格是否将持续沿着你预计的方向波动,这样,你的交易胜算要大得多。该方法的不足之处在于,如果价格在突破后毫不犹豫的加速运行,你可能错过最佳的获利机会。
How to Trade Breakouts Using Trend Lines, Channels and Triangles
Just like breakouts on your face, the nice thing about breakout trading in forex is that opportunities are pretty easy to spot with the naked eye! Unlike the former, you don’t even have to look in the mirror!
Once you start getting used to the signs of breakouts, you’ll be able to spot good potential trades fairly quickly.
Chart Patterns
By now you should be accustomed to looking at charts and recognizing familiar patterns that indicate a reversal breakout. Here are just a few:
- Double Top/Bottom
- Head and Shoulders
- Triple Top/Bottom
For more information check out our lesson on chart patterns.
In addition to chart patterns there are several tools and indicators you can use to supplement your case for a reversal breakout.
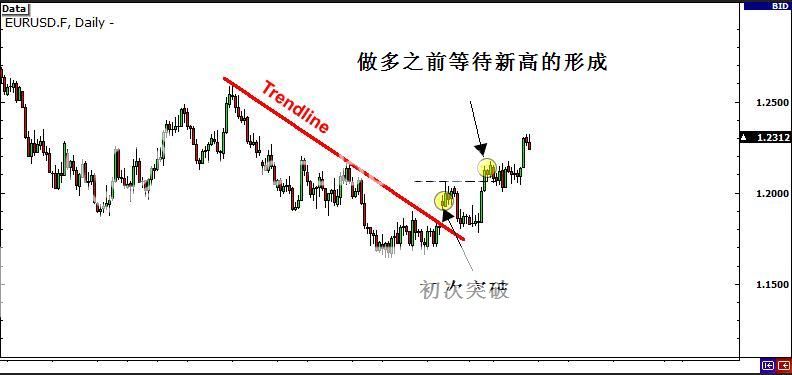
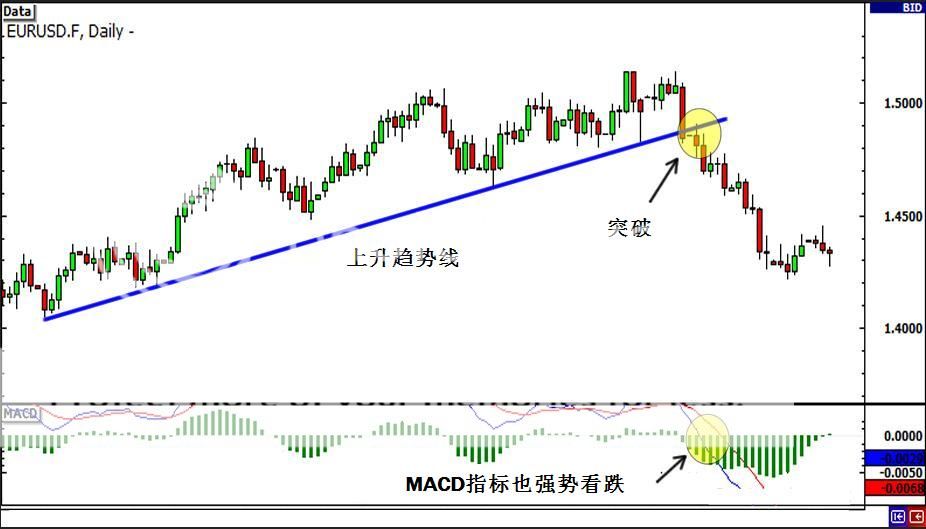
Trend Lines
The first way to spot a possible breakout is to draw trend lines on a chart. To draw a trend line you simply look at a chart and draw a line that goes with the current trend.

When drawing trend lines it is best if you can connect at least two tops or bottoms together. The more tops or bottoms that connect, the stronger the trend line.
So how can you use trend lines to your advantage? When the price approaches your trend line, only two things can happen. The price could either bounce off the trend line and continue the trend OR price could breakout through the trend line and cause a reversal. We want to take advantage of that breakout!
Looking at the price is not enough however. This is where using one or more of the indicators mentioned earlier in this lesson could help you tremendously.

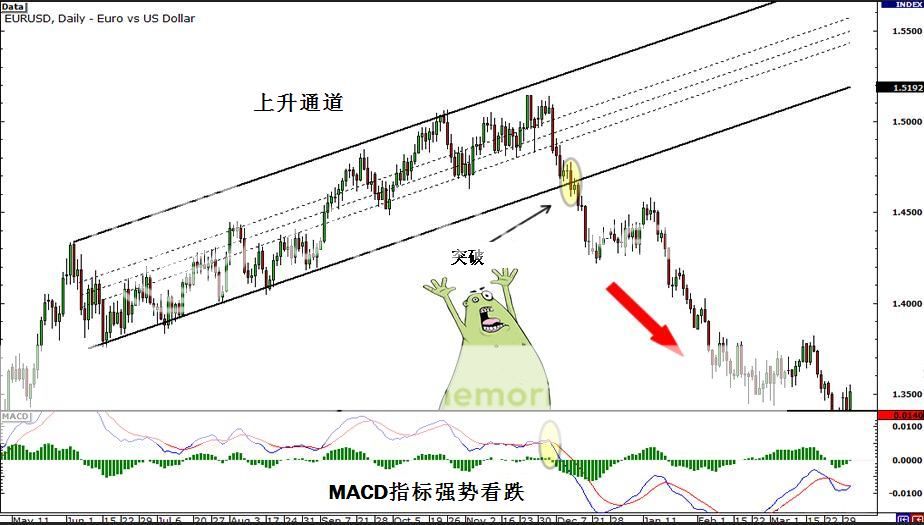
Notice that as EUR/USD broke the trend line MACD was showing bearish momentum. Using this information we can safely say that the breakout will continue to push the euro down and as traders, we should short this pair.
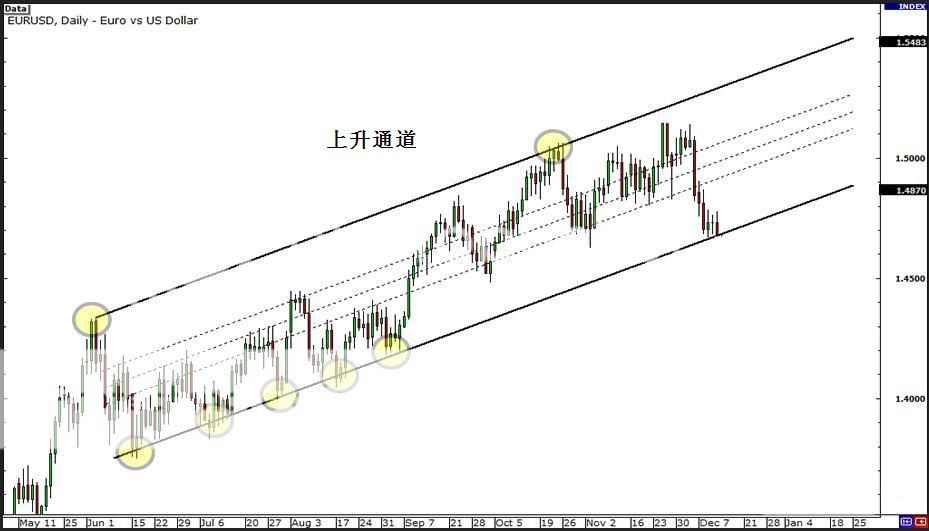
Channels
Another way to spot breakout opportunities is to draw trend channels. Drawing trend channels are almost the same as drawing trend lines except that after you draw a trend line you have to add the other side.

Channels are useful because you can spot breakouts on either direction of the trend. The approach is similar to how we approach trend lines in that we wait for the price to reach one of the channel lines and look at the indicators to help us make our decision.

Notice that the MACD was showing strong bearish momentum as EUR/USD broke below the lower line of the trend channel. This would’ve been a good sign to go short!
Triangles
The third way you can spot breakout opportunities is by looking for triangles. Triangles are formed when the market price starts off volatile and begins to consolidate into a tight range. Our goal is to position ourselves when the market consolidates so that we can capture a move when a breakout occurs.
There are 3 types of triangles:
- Ascending triangle
- Descending triangle
- Symmetrical triangle
Ascending Triangles
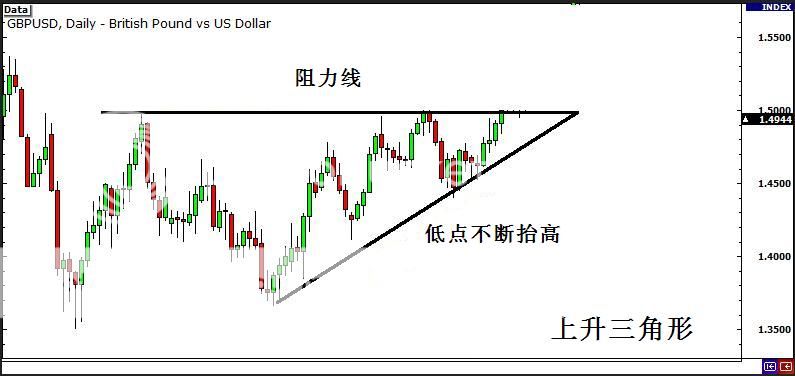
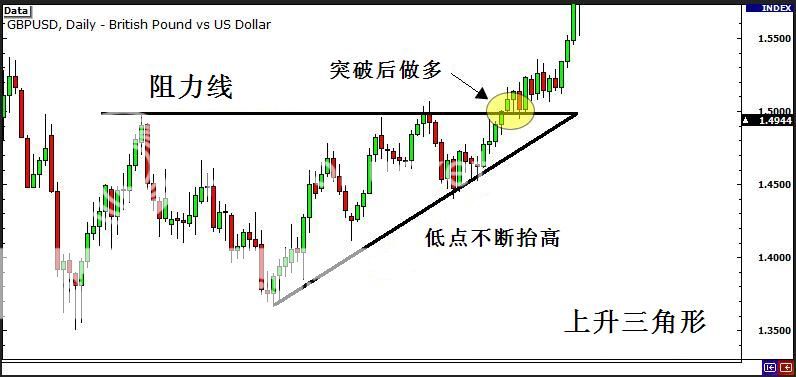
Ascending triangles form when there is a resistance level and the market price continues to make higher lows. This is a sign that the bulls are slowly starting to gain momentum over the bears.

The story behind an ascending triangle is that each time the price reaches a certain high, there are several traders who are convinced about selling at that level, resulting in the price dropping back down.
On the other side, there are several traders who believe the price should be higher, and as the price begins to drop, buy higher than its previous low. The result is a struggle between the bulls and bears which ultimately converges into an ultimate showdown…

What we are looking for is a breakout to the upside since ascending triangles are generally bullish signals. When we see a breach of the resistance level the proper decision would be to go long.

Descending Triangles
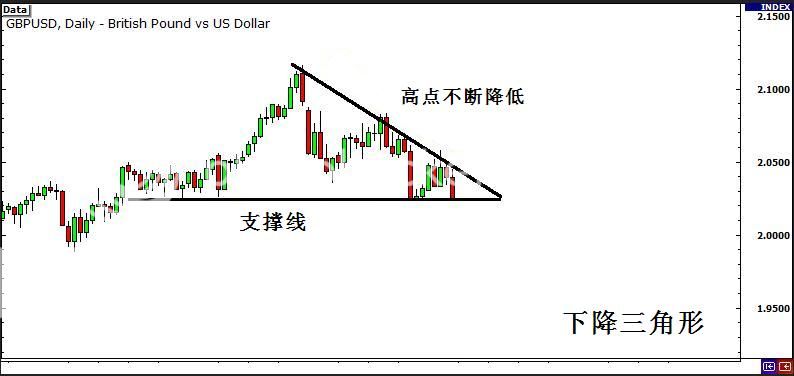
Descending triangles are basically the opposite of ascending triangles. Sellers are continuing to put pressure on the buyers, and as a result, we start to see lower highs met by a strong support level.

Descending triangles are generally bearish signals. To take advantage of this, our goal is to position ourselves to go short if the price should breakout below the support level.

Symmetrical Triangles
The third type of triangle is the symmetrical triangle. Rather than having a horizontal support or resistance level, both the bulls and the bears create higher lows and lower highs and form an apex somewhere in the middle.

Unlike the ascending and descending triangles which are generally bullish and bearish signals, symmetrical triangles have NO directional bias. You must be ready to trade a breakout on either side!

In the case of the symmetrical triangle, you want to position yourself to be ready for both an upside or downside breakout. A perfect time to use the one-cancels-the-other (OCO) order! Don’t remember what an OCO order is? Go review your types of orders!

In this scenario, GBP/USD broke out on the upside and our long entry was triggered.
Breaking down the Triangle Breakouts
To help you memorize the different types of triangle breakouts, just think of facial breakouts.
Ascending triangles usually breakout to the upside. So when you think of ascending triangles, think of breaking out on your forehead.
Descending triangles usually breakout to the downside. So when you think of descending triangles, think of breaking out on your chin.
Symmetrical triangles can break either to the upside or the downside. So when you think of symmetrical triangles, think of breaking out on both your chin and forehead.

Here’s a quick and disgusting memory tickler:
Ascending triangle = Forehead breakout
Descending triangle = Chin breakout
Symmetrical triangle = Forehead OR chin breakout
EWWWW!!!!
Gross eh? But we bet you’ll remember it!
突破的识别
事实上,我们仅凭自己的双眼就能够识别突破行情。一旦你已熟悉突破行情可能出现的信号,你将能够很快的识别出潜在的交易机会。
图形形态
现在,你应该养成观察图形并识别出会发出反转突破信号的图形形态。以下便是一些相关的图形形态:
● 双顶和双底
● 头肩顶和头肩底
● 三重顶和三重底
如果你需要了解更多信息,可以回顾一下我们之前所讲过的图形形态相关课程。
除了图形形态外,还有一些工具和指标可以用来识别反转突破行情。
趋势线
识别可能出现的突破行情的第一种方法是在技术图形上画趋势线,方法很简单,你只需要沿着当前价格的运行方向画一条直线即可。
当画趋势线的时候,如果你能够连接价格的两个顶部或底部,这是最好不过的了。趋势线所连接的顶部或底部越多,趋势线越强劲。
那么,你如何利用趋势线进行突破行情交易呢?当价格触及趋势线时,只有两件事可能发生,价格要么自趋势线反弹并延续之前趋势,或突破趋势线并引发反转走势。我们所需要的就是利用好突破行情。
不过,仅凭趋势线来判断突破行情还不够,利用一种或多种我们在本课之前所介绍的技术指标可以将给你提供巨大的帮助。
如图所示,随着欧元/美元跌破趋势线支撑,MACD指标也显示出疲软走势。结合这一信息,我们更有理由说,突破行情将打压欧元/美元持续走低,我们应该选择做空该货币对。
通道
另一种识别突破机会的方法是画趋势通道。趋势通道的画法和趋势线的画法类似,唯一的不同是,在你画完趋势线后,你需要再画一条与之平行的线。
通道是非常有用的,因为你能够在通道的任意一方识别突破行情。使用通道的方法和我们使用趋势线的方法一样,即等到价格触及某一条通道线,并结合技术指标来确定突破的有效性,进而帮助我们做出相应的操作策略。
如图所示,MACD指标发出较强的看跌信号,同时欧元/美元跌破通道下轨。这可是难得的做空机会!
三角形
识别突破机会的第三种方法是借助三角形态。当市场摆脱震荡行情,并开始维持在较窄区间内窄幅整理时,三角形态宣告形成。我们的目的是,当市场出现盘整格局时,我们能够进行相应的头寸调整,以便当突破行情出现时,可以抓住随之而来的趋势行情。
有三种类别的三角形态:
1. 上升三角形
2. 下降三角形
3. 对称三角形
上升三角形
当价格低点不断抬升,不过始终难以突破上方压力线阻力,此时便形成上升三角形。上升三角形给我们发出的信号是,市场多头力量正在逐渐超过空头。
上升三角形给我们提供的更多信息是,每次价格触及一定高度,都有一些交易者相信在该位卖出,进而导致价格自该位回落。
另一方面,也有另外一些交易者相信,价格应该进一步走高,而且随着价格开始下跌,他们会在较之前低点更高的价位买入。结果就是,多空双方的拉锯战,这场战争最终会以一方的完胜而收场。

鉴于上升三角形通常发出看涨信号,我们所寻找的是上行突破的机会。当我们看到汇价突破上方阻力位,最合理的决定应该是着手做多。
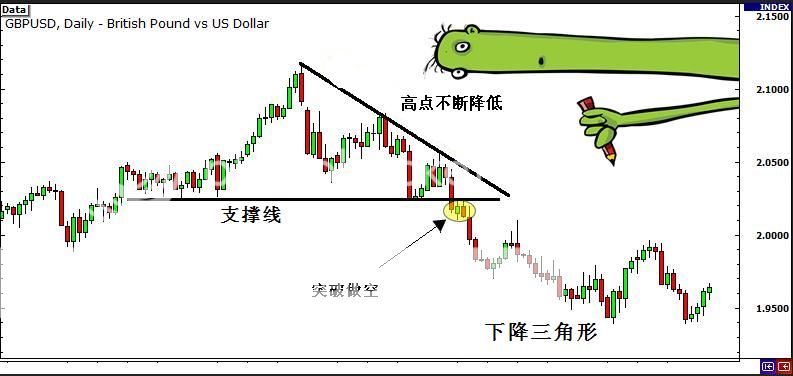
下降三角形
下降三角形运行方向和上升三角形正好相反。卖方持续给买方施压,结果我们看到的就是,价格高点持续走低,并形成一条强支撑位。
下降三角形通常看跌。利用这一优势,我们可以在价格跌破支撑位时选择做空。
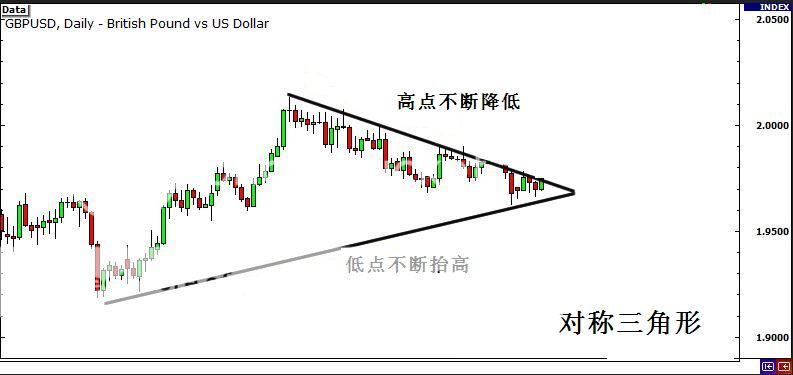
对称三角形
第三种三角形态是对称三角形。和上升三角形形成水平的阻力位以及下降三角形形成水平的支撑位不同,在对称三角形情况下,市场多头和空头合力促使价格高点不断走低,低点不断抬高,最终促使汇价聚集于中部的顶点。
和上升三角形通常看涨以及下降三角形通常看跌不同,对冲三角形没有明确的方向偏好。你应该做好汇价朝上或下任一方向波动的准备。
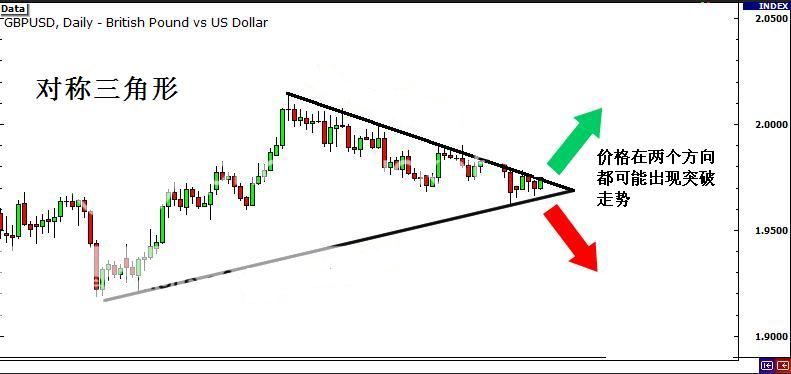
在对称三角形情况下,最理想的做单方法是设置选择性委托定单(OCO),不知道OCO定单什么意思?回到我们幼儿园课程查看有关定单类型的讲解吧。
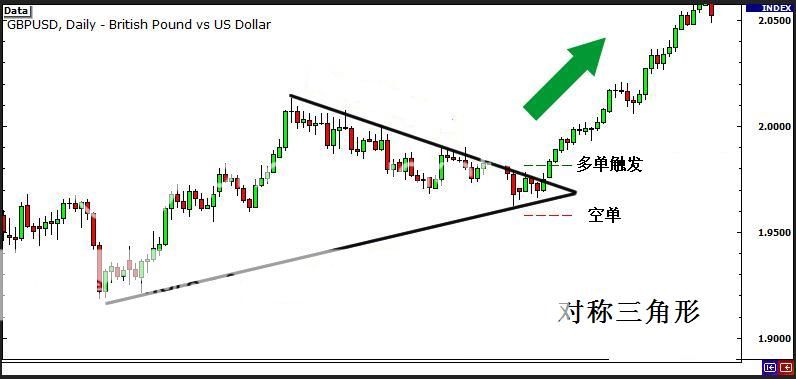
在本例中,英镑/美元出现上行突破走势,汇价也因此触发买盘定单。
简单理解三角形突破的方法
为了帮你记住不同种类三角形态的突破情况,还是让我们拿挤痘痘做比方吧。
上升三角形通常出现上行突破走势。所以当你想到上升三角形时,你就想着在你的额头挤破青春痘时的情境。
下降三角形通常出现下行突破走势。所以当你想到下降三角形时,就想想在你的下巴上挤破青春痘的情形吧。
上行突破和下行突破在对称三角形中都有可能出现。所以当你想到对称三角形时,就想想在你的下班和额头挤破痘痘的情况吧。

简单总结一下,就是:
上升三角形 = 挤破额头的痘痘
下降三角形 = 挤破下巴的痘痘
对称三角形 = 挤破额头或下巴的痘痘
How to Measure the Strength of a Breakout
As you learned earlier, when a trend moves for an extended period of time and it starts to consolidate, one of two things could happen:
- The price could continue in the same direction (continuation breakout)
- The price could reverse in the opposite direction (reversal breakout)
Wouldn’t it be nice if there was a way to know to confirm a breakout? If only there was a way to avoid fake outs…
Hmmm…
You guessed it…. THERE IS A WAY!
In fact, there are a couple of ways to tell whether or not a trend seems to be nearing its demise and a reversal breakout is in order.
Moving Average Convergence/Divergence (MACD)
By now you should have a good foundation of the MACD indicator. If you don’t, you might want to check out our lesson on MACD.
MACD is one of the most common indicators used by forex traders and for good reason. It is simple yet dependable and can help you find momentum, and in this case, the lack of momentum!
MACD can be displayed in several ways but one of the “sexiest” ways is to look at it as a histogram. What this histogram does is actually show the difference between the slow and fast MACD line. When the histogram gets bigger, it means momentum is getting stronger. When the histogram gets smaller, it means momentum is getting weaker.

So how can we use this when trying to spot a trend reversal? Glad you asked!
Remember that trading signal we talked about earlier called divergences and how it occurs when the price and indicators move in the opposite direction? Since MACD shows us momentum it would make sense that momentum would increase as the market makes a trend. However, if MACD begins to decrease even when the trend is continuing, you can deduce that momentum is decreasing and this trend could be close to an end.

You can see from the picture that as price was moving higher, MACD was getting smaller. This meant that even as the price was still trending, momentum was beginning to fade out. From this information, we can conclude that a trend reversal is highly likely.
Relative Strength Index (RSI)
RSI is another momentum indicator that is useful for confirming reversal breakouts. Basically, this indicator tells us the changes between higher and lower closing prices for a given period of time. We won’t go into too much detail about it but if you would like to know more check out our lesson on RSI.
RSI can be used in a similar way to MACD in that it also produces divergences. By spotting these divergences, you can find possible trend reversals.

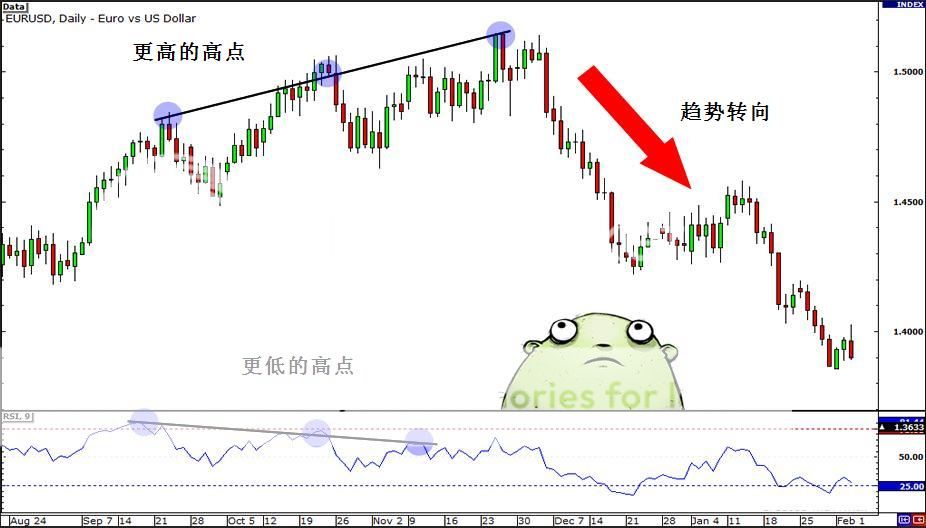
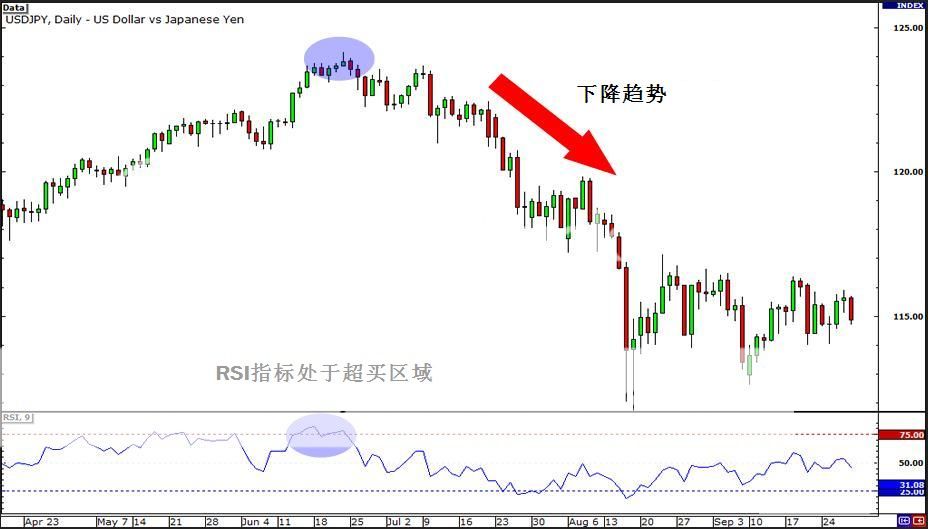
However, RSI is also good for seeing how long a trend has been overbought or oversold. A common indication of whether a market is overbought is if the RSI is above 70. On the flipside, a common indication of whether a market is oversold is if the RSI is below 30.
Because trends are movements in the same direction for an extended period of time, you will often see RSI move into overbought/oversold territory, depending on the direction of the trend.
If a trend has produced oversold or overbought readings for an extended period of time and begins to move back within the range of the RSI, it is a good indication that the trend may be reversing.

In the same example as before, the RSI showed that the market was overbought for a billion days (ok not that long). Once RSI moved back below 70, it was good indication that the trend was about to reverse.
突破强度的测量
你之前已经学过,当价格在经历一段更长时间趋势行情并开始横盘整理后,有两种情形可能发生:
1. 价格可能沿着之前的趋势方向运行(持续突破)
2. 价格可能反向朝反方向运行(反转突破)
如果有一种方法来证实突破的发生,是不是非常美妙?
事实上,有众多的方法来告诉我们,趋势将接近尾声,或反转突破行情即将开启。
MACD指标
MACD指标是交易者使用最为广泛的技术指标之一,它使用简便,但是帮助你观察价格动能变动情况却非常有效,而在我们判断市场突破行情时,我们需要判断的是价格缺乏动能时的情况。
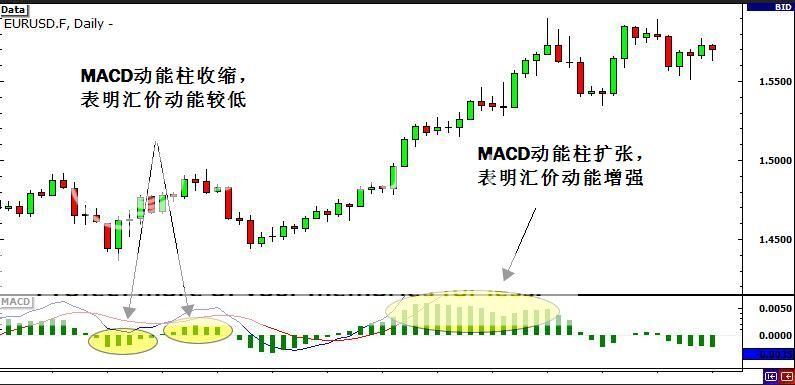
MACD指标能以多种方式显示,但是,以柱状图显示是最有趣的一种显示方式。柱状图实际上显示的是MACD快慢线之差。当动能柱变长时,则意味着动能正在增强,当动能柱变短时,则意味着动能正在减弱。
那么,当我们在识别价格反转时,我们该如何使用该指标呢?问题问得很好!
记住,背离的出现会发出较为有效的交易信号,当背离出现时,价格和动能指标通常呈反向运动。鉴于MACD显示出价格动能的变动情况,那么,当市场趋势开启时,动能通常是会增强的。不过,如果出现即便趋势延续,但MACD动能开始下降情况,你可以推出,动能正在降低,且当前趋势可能正接近尾声。
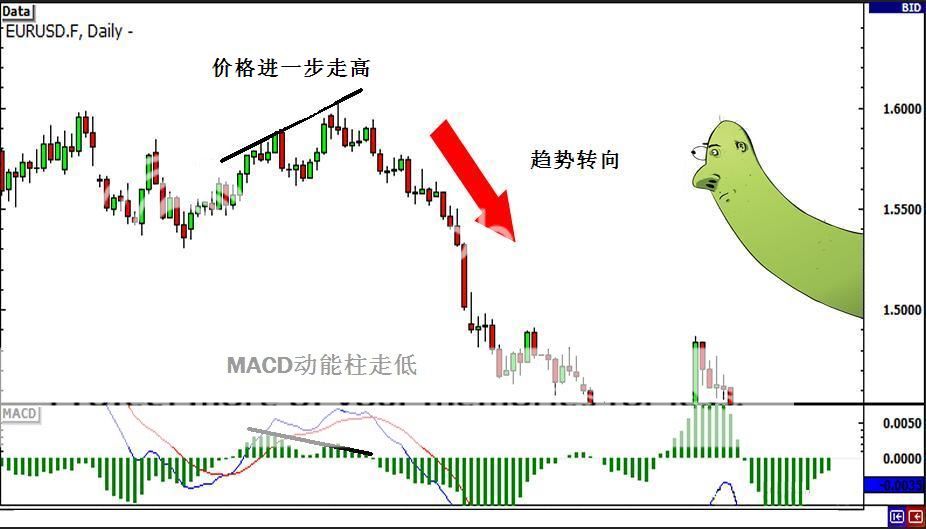
从上图中,你可以看到,尽管价格进一步走高,但是MACD动能柱却持续收缩。这意味着,尽管价格仍在延续之前趋势运行,不过动能正开始消退。从这一信息中,我们可以得出结论,趋势转向的可能性非常之高。
RSI指标
RSI指标是另一种证实反转突破的有效动能指标。一般上来说,该指标告诉我们,一段时间以内更高和更低收盘价之间的变动情况。
RSI指标能够和运用MACD指标相同的方法来使用,即它也可以发出背离信号。一旦你识别了这一背离状况,那么你便可以找到可能的趋势反转。
不过,RSI指标也能够有效的指出,某一趋势已经有多长时间处于超买或超卖状态。如果RSI指标超过70,则通常意味着市场处于超买状态,如果RSI指标低于30,则通常意味着市场处于超卖状态。
由于价格在更长一段时间内沿着之前趋势波动,你通常将看到RSI指标运行至超买或超卖区域,是否超买或超卖,这通常由趋势的方向来决定。
如果RSI指标显示某一趋势在更长一段时间已经处于超买状态,并且随后开始脱离超买区域,那么这很可能暗示,趋势即将出现转向。
如上图所示,RSI指标显示市场在数个交易日内均处于超买状态。一旦RSI指标回落至70以下,则表明趋势很可能出现转向。
How to Detect Fakeouts
Breakouts are popular among forex traders.
It makes sense right?
When price finally “breaks” out of that support or resistance level, one would expect price to keep moving in the same direction of the break. There must have been enough momentum building up in order for price to have broken out of the level, right?
It’s time to hop aboard that train. It’s all smooth sailing now. All you have to do is just wait for it…
Yes, wait for it…

Wait for it… Just a few more moments… To see price inch one direction… Then suddenly move miles in the opposite direction!

Huh?!? What the heck?! What happened to “the bread and butter and the end of world hunger” strategy?
End of story: You are left eating ketchup packets and crackers like Tom Hanks in The Terminal.
Support and Resistance Levels Are Tricky
One thing you should remember to note about support and resistance levels is that they are areas in which a predictable price response can be expected.
Support Levels
Support levels are areas where buying pressure is just enough to overcome selling pressure and halt or reverse a downtrend.
A strong support level is more likely to hold up even if price breaks the support level and it provides traders a good buying opportunity.
Resistance Levels
Resistance levels are just like support levels but work in the opposite way. They tend to halt or even reverse uptrends.
Resistance levels are areas in which selling pressure is just enough to overcome buying pressure and force price back down.
Strong resistance levels are more like to hold up even if price breaks the resistance level and it provides traders a good selling opportunity.
In the next section, we will dive deeper into fakeouts and discuss why we should trade them and how to profit off them.
It’s not enough learning about breakout strategies because there will be times that breakouts fail. We have to know what to do in case of fakeouts.
This is part of your Jedi forex training. To be a Jedi master, you must be able to master fakeouts.
Are you up for it?
检测假突破
交易者们普遍对突破行情表示关注。这对他们来说很有意义。
当价格最终突破支撑或阻力位,我们一般会预计价格将沿着突破方向继续波动。为了使价格突破支撑位或阻力位,首先需要确保价格有足够的动能,是吧?
现在是时候登上这趟列车,旅行将会很愉快,你所要做的就是等待。
是的,就是等待。
我们只需要等等,我们看到,价格沿着某一方向缓慢移动,然后,突然之间反向剧烈波动。
有一点,你需要记住的是,支撑和阻力位是这么一种区域,价格则触及上述价格区域后,走势可能出现转向。
支撑位是这么一些区域,在这里买盘力量足以战胜卖盘力量,并止住市场跌势,或促使跌势出现逆转。
强支撑位很可能保持稳定,即使价格可能一度跌破该位,这将为交易者提供良好的买入机会。
阻力位和支撑位相似,但是它扮演着和支撑位对立的角色。阻力位倾向于止住价格涨势,或促使价格逆转走低。
强阻力位很可能保持稳定,即使价格可能一度突破该位,这将为交易者提供良好的卖出机会。
在下课中,我们将对假突破进行更深入讨论,比如为什么我们应该交易假突破,以及如何利用假突破获利。
学习突破交易策略还不够,因为市场通常会出现假突破行情。我们需要知道,当出现假突破时,到底该怎么做。
这是你成为外汇交易领域中的绝地武士所不可或缺的一节课程,为了成为绝地武士,你必须精通如何交易假突破行情。
准备好了吗?
Fade the Breakout
Fade the breakout you say? Was that just a typo? Did you mean to say, “trade the breakout”?
Nope!
Fading breakouts simply means trading in the opposite direction of the breakout.
Fading breakouts = trading false breakouts.
You would fade a breakout if you believe that a breakout from a support or resistance level is false and unable to keep moving in the same direction.
In cases in which the support or resistance level broken is significant, fading breakouts may prove to be smarter than trading the breakout.
Keep in mind that fading breakouts is a great short-term strategy. Breakouts tend to fail at the first few attempts but may succeed eventually.
REPEAT: Fading breakouts is a great short-term strategy. It is NOT a great one to use for longer term traders.
By learning trade false breakouts, also known as fakeouts, you can avoid getting whipsawed.
Trading breakouts appeal to many forex traders. Why?
Support and resistance levels are supposed to be price floors and ceilings. If these levels are broken, one would expect for price to continue in the same direction as the breakage.
If a support level is broken, that means that the general price movement is downwards and people are more likely to sell than buy.
Conversely, if a resistance level is broken, then the crowd believes that price is more likely to rally even higher and will tend to buy rather than sell.
Independent retail forex traders have greedy mentalities. They believe in trading in the direction of the breakout. They believe in huge gains on huge moves. Catch the big fish, forget the small fries.
In a perfect world, this would be true. But the world is not perfect. Frogs and princesses do not live happily ever after. What does in fact happen is that most breakouts FAIL.
Breakouts fail simply because the smart minority has to make money off the majority. Don’t feel so bad. The smart minority tends to be comprised of the big players with huge accounts and buy/sell orders.
In order to sell something, there must be a buyer. However, if everyone wants to buy above a resistance level or sell below a support level, the market maker has to take the other side of the equation. And let us warn you: the market maker ain’t no fool.

Retail traders like to trade breakouts.
The smart minority, the institutional, more seasoned traders, prefer to fade breakouts.
The smarter forex traders take advantage of the collective thinking of the crowd or inexperienced traders and win at their expense. That is why trading alongside the more experienced forex traders could be very profitable as well.
Which would you rather be part of: the smart minority that fades breakouts or the losing majority that gets caught in false breakouts?
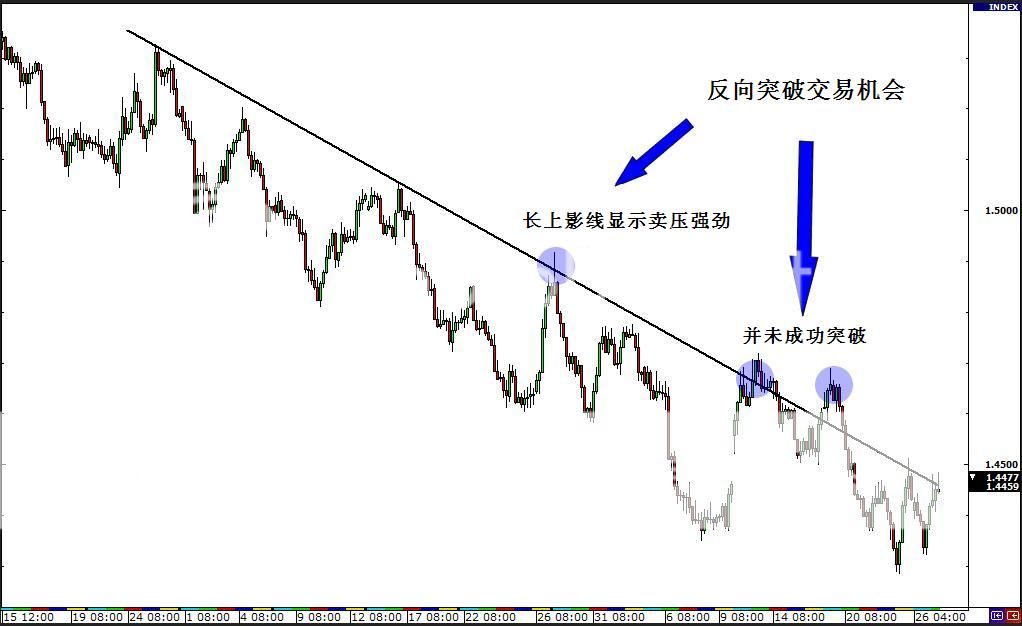
反向突破交易
如果你相信,价格对某一支撑位或阻力位的突破为假突破,而且难以沿着此前的方向波动,你可以进行反向突破交易。进行反向突破交易可能被证明比进行突破交易更为精明。
请记住,反向突破交易是非常有效的短期交易策略。在价格开始阶段测试支撑或阻力位时可能以失败而告终,但是最终仍有可能成功。
再重复一遍:反向突破交易时一种非常有效的短期交易策略。它不大适用于长线交易者。通过对虚假突破交易的学习,你能够避免变得茫然不知所措。
反向突破交易对众多独立的交易者来说具有相当的吸引力,为什么呢?
支撑位和阻力位就分别好比地板和天花板。如果这些价位被突破,我们会预计,价格可能会沿着突破方向继续波动。
如果某一支撑位被突破,这意味着总体价格运行方向将向下,人们卖出的可能性比买入要更大。
反过来说,如果阻力位被突破,那么大多数人会认为,价格更有可能进一步走高,相比于卖出,人们会更倾向于买入。
独立的外汇散户具有贪婪的心态。他们相信,沿着突破的方向进行交易会获得巨额回报。他们相信,巨幅的波动伴随着巨大的收益。他们总是想抓住池子里的大鱼,而忘了大鱼附近的小鱼。
在完美世界中,这种想法将是正确的。但是,我们的世界并不完美。王子和公主最终并不总是过上了幸福的生活。事实上,绝大多数突破都以失败而告终。
突破失败的简单原因在于,小部分交易者必须从大多数交易者那里赢得金钱。请记住,精明的小部分交易者可是市场中的大玩家,他们有着巨额的账户,所下的买单或卖单都是天文数字。
我们要卖出什么,前提是必须要有买方的存在。不过,如果每一个人都打算在阻力位上方买进,或在支撑位下方卖出,市场将偏向天平的另一边。让我们警告你的是:市场可没这么笨!

外汇散户们喜欢交易突破行情。
精明的小部分交易者,比如机构投资者、更为老练的交易者,都喜欢进行反向突破交易。
精明的交易者会利用大多数散户或经验不足交易者的想法做文章,并在和他们的博弈中处于上风。这也是为什么,在精明的交易者旁边交易,也可能获得非常可观的收益。
你应该记住:精明的少数交易者进行反向突破交易,而绝大多数交易者则在虚假突破行情中损失惨重。
How to Trade Fakeouts
In order to fade breakouts, you need to know where potential fakeouts can occur.
Potential fakeouts are usually found at support and resistance levels created through trend lines, chart patterns, or previous daily highs or lows.
Trend lines
In fading breakouts, always remember that there should be SPACE between the trend line and price.
If there is a gap between the trend line and price, it means price is heading more in the direction of the trend and away from the trend line. Like in the example below, having space between the trend line and price allows price to retrace back towards the trend line, perhaps even breaking it, and provide fading opportunities.

The SPEED of price movement is also very important.
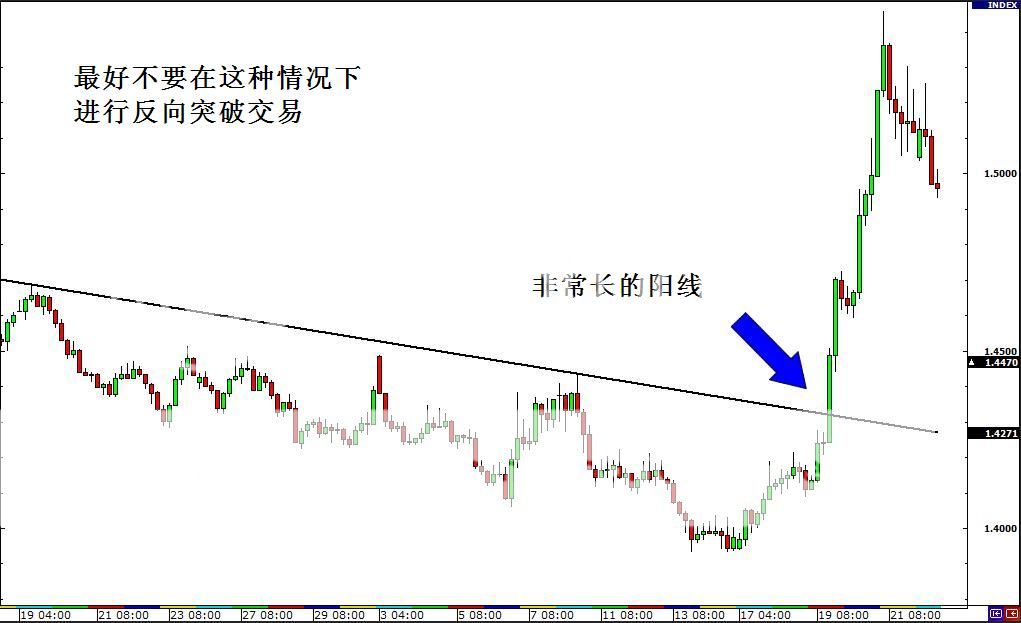
If price is inching like a caterpillar towards the trend line, a false breakout may be likely. However, a fast price movement towards the trend line could prove to be a successful breakout. With a high price movement speed, momentum can carry price past the trend line and beyond. In this situation, it is better to step back from fading the breakout.

How do we fade trend line breaks?
It’s very simple actually. Just enter when price pops back inside.
This will allow you to take the safe route and avoid jumping the gun. You don’t want sell above or below a trend line only to find out later that the breakout was real!
Using the first chart example, let’s point out possible entry points by zooming in a little.

Chart Patterns
Chart patterns are physical groupings of price you can actually see with your own eyes. They are an important part of technical analysis and also help you in your decision-making process.
Two common patterns where false breakouts tend to occur are:
- Head and Shoulders
- Double Top/Bottom
The head and shoulders chart pattern is actually one of the hardest patterns for new traders to spot. However, with time and experience, this pattern can become an instrumental part of your trading arsenal.
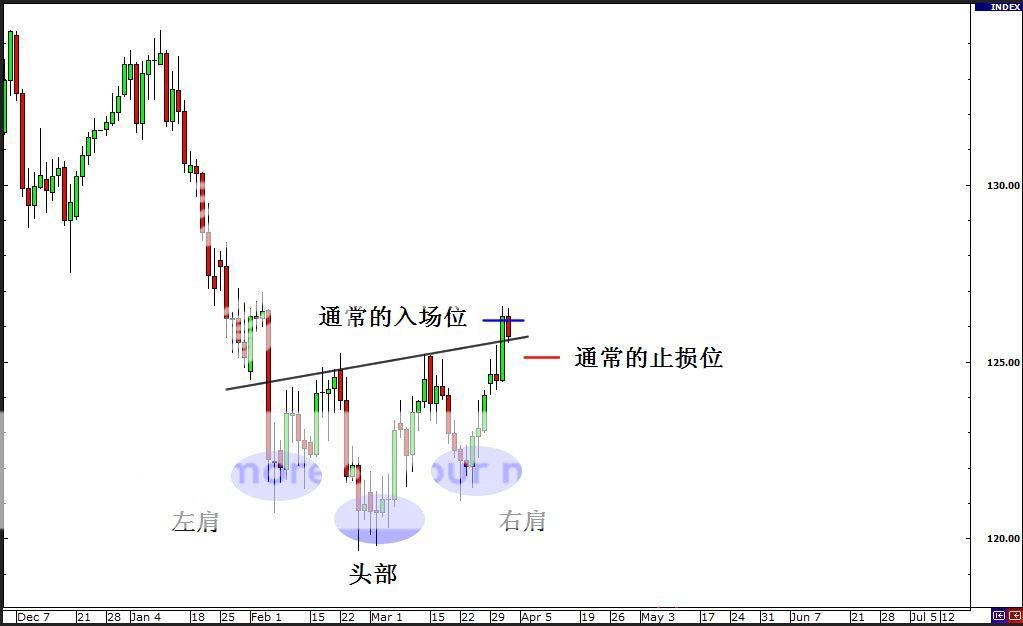
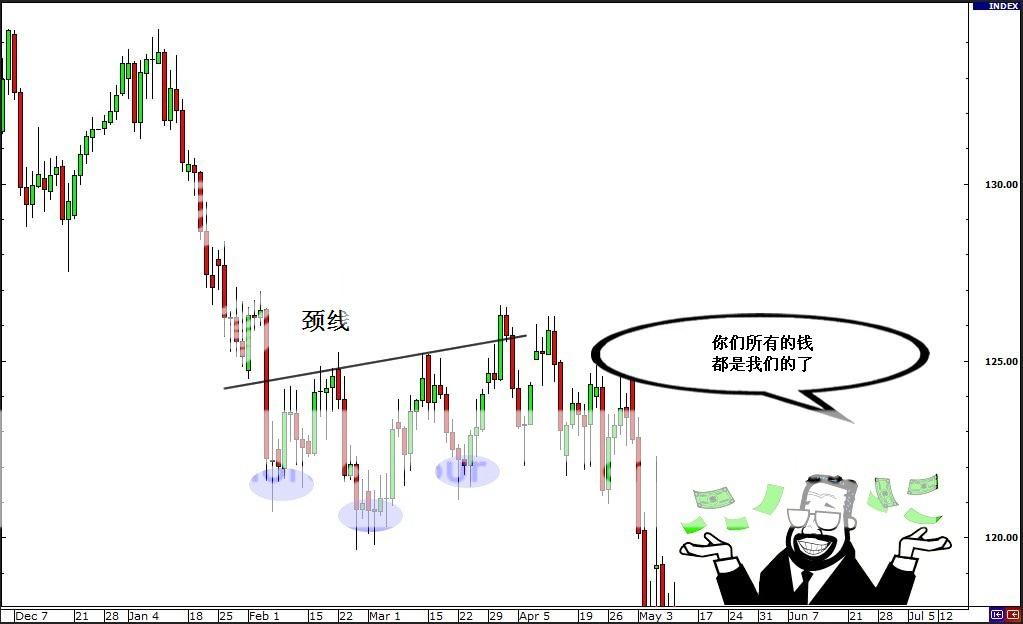
The head and shoulders pattern is considered a reversal. If formed at the end of an uptrend, it could signal a bearish reversal. Conversely, if it is formed the end of a downtrend, it could signal a bullish reversal. Head and shoulders are known for generating false breakouts and creating perfect opportunities for fading breakouts.
False breakouts are common with this pattern because many traders who have noticed this formation usually put their stop loss very near the neckline.

When the pattern experiences a false breakout, prices will usually rebound. Traders who have sold the downside breakout or who have bought the upside breakout will have their stops triggered when prices move against their positions. This usually is caused by the institutional traders who want to scrape money from the hands of individual traders.

In a head and shoulders pattern, you can assume that the first break tends to be false.
You can fade the breakout with a limit order back in the neckline and just put your stop above the high of the fake out candle.
You could place your target a little below the high of the second shoulder or a little above the low of the second shoulder of the inverse pattern.
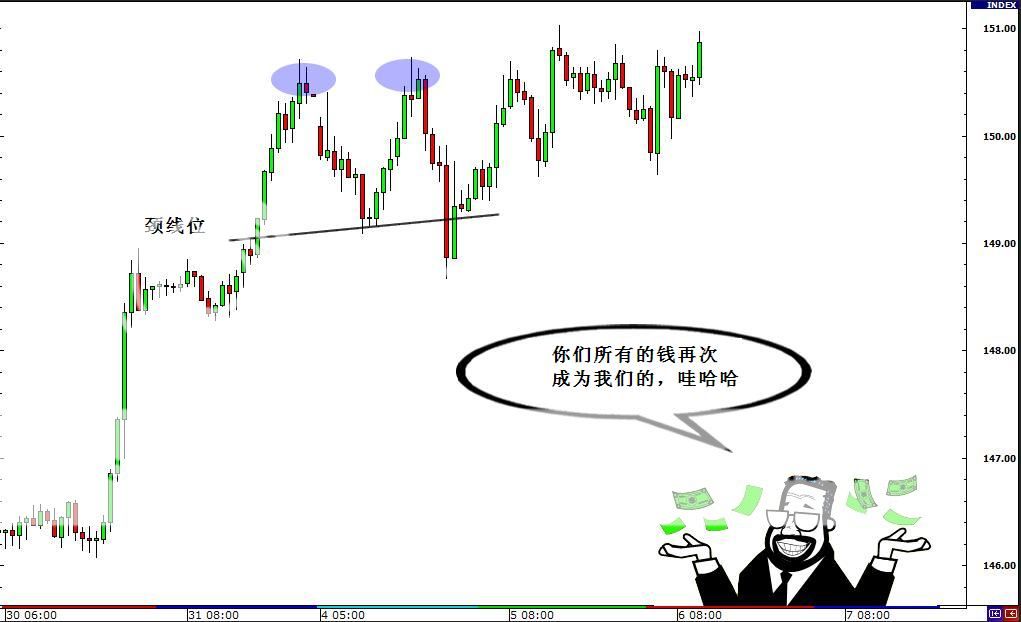
The next pattern is the double top or the double bottom.
Traders just love these patterns! Why you ask? Well it is because they’re the easiest to spot!
When price breaks below the neckline, it signals a possible trend reversal. Because of this, plenty of traders place their entry orders very near the neckline in case of a reversal.

The problem with these chart patterns is that countless traders know them and place orders at similar positions. This leaves the institutional traders open to scrape money from the commoner’s hands.

Similar to the head and shoulders pattern, you can place your order once price goes back in to catch the bounce. You can set your stops just beyond the fake out candle.
What kind of market should I fade breakouts?
The best results tend to occur in a range-bound market. However, you cannot ignore market sentiment, major news events, common sense, and other types of market analysis.
Financial markets spend a lot time bouncing back and forth between a range of prices and do not deviate much from these highs and lows.
Ranges are bound by a support level and a resistance level, and buyers and sellers continually push prices up and down within those levels. Fading the breakouts in these range-bound environments can prove to be very profitable. However, at some point, one side is eventually going to take over and a new trending stage will form.
如何交易假突破
为了进行反向突破交易,你需要知道潜在的反向突破会发生在哪里。
潜在的虚假突破通常见于由趋势线所组成的支撑或阻力位、技术形态或前日高或日低水平。
趋势线
在反向突破交易中,我们需要始终记住,趋势线和价格之间应该存在一定空间。
如果趋势线和价格之间存在缺口,这意味着价格沿着当前趋势走势有些过,并远离了趋势线。如下图所示,价格和趋势线之间所存在的空间,这促使价格随后朝着趋势线目标回撤,甚至跌破趋势线支撑,这为反向突破提供了非常好的机会。
价格运动的速度也非常重要
如果价格像毛毛虫一样朝着趋势线方向运动,假突破很可能出现。不过,价格沿着趋势线方向快速移动可能证明突破的有效性。由于价格运动的速度很快,动能能够促使价格快速突破趋势线。在这一情况下,最好不要尝试反向突破交易。
我们该如何进行反向突破交易呢?
实际上非常简单。只需要在价格回撤至趋势线下方即可(这里我们选取的是下降趋势线)。
这样操作将更为保险,并避免你出现判断错误的情况。你也不想看到,价格运行至趋势线下方或上方卖出,却发现突破是真实有效的吧。
借用第一个图形的例子,让我们来看看可能设置的入场点位吧。
图形形态
图形形态是你仅凭自己的双眼都可以识别的价格形态。它们是技术分析的重要组成部分,也能够帮助你做出正确的交易决策。
假突破容易在两种普遍的图形形态中出现:
● 头肩形
● 双顶/双底
头肩形态的识别对于交易新手来说是最难识别的。不过,通过经验的积累,这一形态能够成为你的交易工具箱中的厉害武器。
头肩形态是一种反转形态。它形成于上升趋势的末期,可能意味着价格走势将反转并走低。反过来说,如果它形成于下跌趋势的末期,则可能发出看涨逆转的信号。头肩形态易于出现假突破的情况,这也为反向突破交易提供了非常好的机会。
假突破经常出现在头肩形态中,因为多数交易者都会注意到这一形态,进而将止损设在非常接近颈线位的地方。
当出现假突破时,价格通常会反弹。那些在价格跌破颈线位后选择做空或突破颈线位后选择做多的交易者,当价格沿着他们的头寸方向反向波动时,他们都有可能被打止损。这一情况通常由大型的机构交易者所致,这些机构交易者目的就是从广大散户那里获利。
在头肩形态中,你可以假设首次突破行情为假突破。
你能够进行反向突破交易,将限价订单设在颈线位下方水平,并将止损设在突破颈线位蜡烛线的最高点。
你也能够将获利目标设在头肩顶右肩高点下方,或倒头肩形态右肩低点上方水平。
下一形态是双顶或双底。
交易者们非常喜欢双顶或双底形态,为什么呢?很简单,因为它们易于识别。
当价格跌破颈线位,则发出走势可能出现逆转的信号。有鉴于此,众多的交易者将入场单设在非常接近颈线位的地方,以期价格反转的发生。
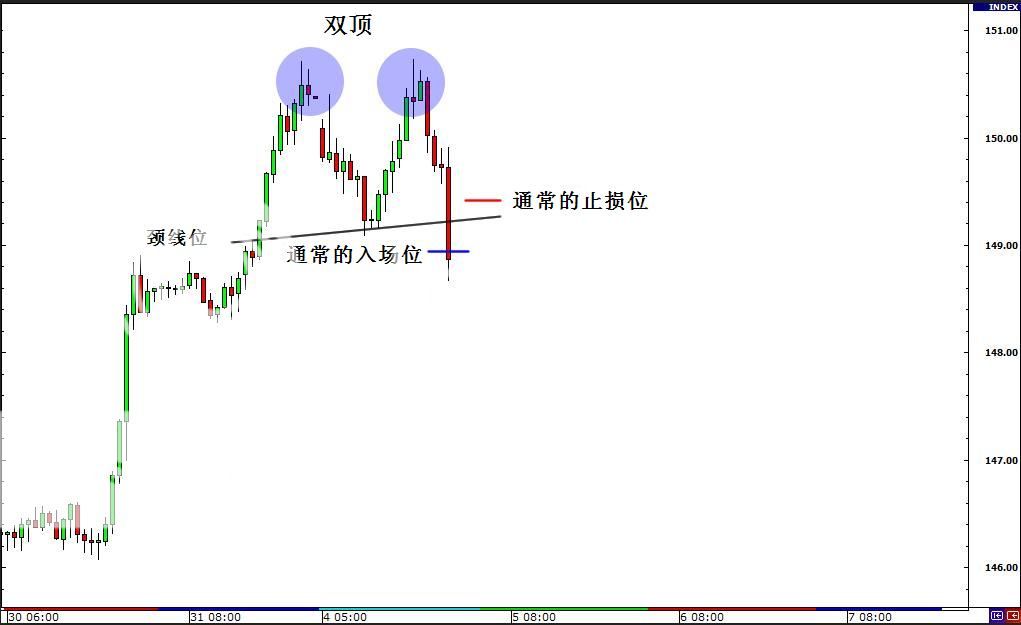
这一形态的问题也在于,有太多的交易者都能够识别该形态,并将入场单设在类似的位置。这也为机构交易者从广大散户那里牟取利润提供了机会。
和头肩形态类似,你也能够在价格反向运动后设置入场单,以抓住价格的反弹机会。你只需要将止损设在出现假突破蜡烛线最低点或下方水平即可。
你可能在问,我应该在什么样的市场中进行反向突破交易?
最理想的答案是,在区间波动市场中。不过,你也不能够忽视市场情绪、主要的新闻事件、常识、以及其他的市场分析方法。
金融市场在大多数时候都是维持在区间以内做来回运动,通常不会偏离高点和低点太远。
交易区间由支撑位和阻力位所限定,在买方和卖方的彼此博弈中,价格维持在阻力位和支撑位所构成的交易区间内做来运运动。在这一市场环境下做反向突破交易能够为交易者提供非常可观的收益。不过,在某一节点,单边市场行情最终可能取代拉锯行情,新的趋势可能随之形成。
Summary Of Trading Breakouts and Fakeouts

Trading Breakouts
With breakout trades, the goal is to enter the market right when the price makes a breakout and then continue to ride the trade until volatility dies down.
Breakouts are significant because they indicate a change in the supply and demand of the currency pair you are trading.
You’ll notice that unlike trading stocks or futures, there is no way for you to see the volume of trades made in the forex. Because of this, we need to rely on volatility.
Volatility measures the overall price fluctuations over a certain time and this information can be used to detect potential breakouts.
There are a few indicators that can help you gauge a pair’s current volatility. Using these indicators can help you tremendously when looking for breakout opportunities.
There are two types of breakouts:
- Continuation
- Reversal
To spot breakouts, you can look at:
You can measure the strength of a breakout using the following:
Finally, breakouts usually work best and FOR REAL with some kind of economic event or news catalyst. Always be sure to check the forex calendar and news before figuring out whether or not a breakout trade is the right play for the situation.
Trading Fakeouts
Institutional traders like to fade breakouts. So we must like to fade breakouts also.
Are you going to follow the crowd, or are you going to follow the money?
Think, act, eat, sleep, and watch the same movies as these guys do. If we can trade in the same way the institutional players do, success is just a glimpse away.
Fading breakouts simply means trading in the opposite direction as the breakout. You would fade a breakout if you believe that a breakout from a support or resistance level is false and unable to keep moving in the same direction.
In cases in which the support or resistance level broken is significant, fading breakouts may prove to be smarter than trading the breakout.
Potential fake outs are usually found at support and resistance levels created through trend lines, chart patterns, or previous daily highs or lows.
The best results tend to occur in a range-bound market. However, you cannot ignore market sentiment, common sense, and other types of market analysis.
Financial markets spend a lot time bouncing back and forth between a range of prices and do not deviate much from these highs and lows.
Finally, the odds of a fake out are higher when there is no major economic event or news catalyst to shift forex traders’ sentiment in the direction of the break.
总结:交易突破和虚假突破

PS:突破交易和反向突破交易是非常棒的交易策略。
突破交易
突破交易,其目的是在价格出现突破行情时入场,并跟随价格走势以实现最大获利,直到价格波动性消失殆尽。
突破行情意味着价格波动将是非常显著的,因为它意味着你所交易货币对供需结构出现改变。
你会注意到,和进行股票交易和期货交易不同,你无法获悉外汇市场的交易量。有鉴于此,我们需要依赖于波动性。
当我们在寻找良好的突破交易机会时,我们能够利用波动性。
波动性衡量的是总体价格在一段时间以内的波动情况,这一信息能够用来侦测潜在的突破行情。
有一些指标能够帮助我们来测量汇价的当前波动性。当我们在寻找突破机会时,利用这些指标将在很大程度上帮助我们。
● 移动均线
● 布林带
● ATR指标
有两种突破形态
● 持续形态
● 反转形态
为识别突破行情,你可以观察一下形态:
● 图形形态
● 趋势线
● 通道
● 三角形
你能够利用以下指标来测量突破的强度:
● MACD指标
● RSI指标
最后需要指出的是,随着相关重大经济数据的公布或重大事件的发生,突破的出现通常会非常有效。在我们决定是否进行突破交易之前,请始终事先核对一下财经日历。
反向突破交易
机构交易者喜欢进行反向突破交易。因此,我们也必须学着进行反向突破交易。
你是想跟随绝大多数人的方向而动,还是跟随金钱的流向而走呢?
绝大多数人想法千篇一律、吃相同是食物、在差不多想通的时间睡觉、会看相同的电影。如果我们能够和机构投资者采取相同的交易方法,成功离我们将不再遥远。
反向突破交易意味着,和突破交易的相反方向进行交易。如果你认为,价格自某一支撑或阻力位的突破为假突破,且难以沿着突破方向进一步运行,你可以进行反向突破交易。
精明的小部分交易者,比如机构投资者、更为老练的交易者,都喜欢进行反向突破交易。
潜在的虚假突破通常见于由趋势线所组成的支撑或阻力位、技术形态或前日高或日低水平。
最理想的答案是,在区间波动市场中。不过,你也不能够忽视市场情绪、主要的新闻事件、常识、以及其他的市场分析方法。
金融市场在大多数时候都是维持在区间以内做来回运动,通常不会偏离高点和低点太远。
组后需要强调的是,当市场没有重大经济指标或事件时,虚假突破出现的几率更高。