Chart Patterns Schmatterns
By now you have an arsenal of weapons to use when you battle the market. In this lesson, you will add yet another weapon: CHART PATTERNS!
Think of chart patterns as a land mine detector because, once you finish this lesson, you will be able to spot “explosions” on the charts before they even happen, potentially making you a lot of money in the process.
Chart patterns are like that funny feeling you get in your tummy right before you let a fart explode.

Don’t you wish you had a chart to detect this explosion?
In this lesson, we will teach you basic chart patterns and formations. When correctly identified, it usually leads to an explosive breakout, so watch out!
Remember, our goal is to spot big movements before they happen so that we can ride them out and rake in the cash. After all, who doesn’t want to have a pool of cash to swim in like Richie Rich?
Chart formations will greatly help us spot conditions where the market is ready to break out. They can also indicate whether the price will continue in its current direction or reverse so we’ll also be devising some nifty trade strategies for these patterns.
Don’t worry, we’ll give you a neat little cheat sheet to help you remember all these cool patterns and strategies!
Here’s the list of chart patterns that we’re going to cover:
- Double Top and Double Bottom
- Head and Shoulders and Inverse Head and Shoulders
- Rising and Falling Wedges
- Bullish and Bearish Rectangles
- Bearish and Bullish Pennants
- Triangles (Symmetrical, Ascending, and Descending)
图表形态的类型表
现在你已经有一些武器,可以在外汇交易的战场上使用了。 在这堂课中,你将添加另一个武器: 图表形态!
把图表形态想象成一个炸弹的探测器,因为当你完成这一课时,你将会开始察觉图表上,即将出现的“爆炸点”,这意味着会让你赚到很多的钱。
图表形态是很有趣的,就像是你的屁会爆炸一样。

难道你不希望得到一个图表,可以用来检测这些爆炸吗?
在这一课,我们将教你基本的图表形态及架构。当你可以正确的区分时,它往往通向一个爆炸性的突破,所以请当心!
请记住,我们的目标是在大波动发生之前,就把它们辨认出来。这样我们就可以骑着它们,然后拼命的敛集现金了。毕竟,谁不想像富公子Richie Rich一样,在满是钞票的游泳池里游泳呢?
图表形态的架构,将大大的帮助我们发现,市场是否具备了突破的条件。它们也可以指示出,价格是否会继续当前的趋势 或是 已经反转。这样我们就可以根据这些形态,来制订一些漂亮的交易策略。
不要担心,我们会给你一个简洁的小备忘录,来帮助你记住这些有型的形态 和 策略!
这些是我们将要学习的模式:
• 双顶(M)和双底(W)
• 头肩型和反头肩型
• 上升和下降 楔形
• 牛市和熊市 矩形
• 牛市和熊市 旗形
• 三角形(对称、上升、下降)
How to Trade Double Tops and Double Bottoms
Double Top
A double top is a reversal pattern that is formed after there is an extended move up. The “tops” are peaks which are formed when the price hits a certain level that can’t be broken.
After hitting this level, the price will bounce off it slightly, but then return back to test the level again. If the price bounces off of that level again, then you have a DOUBLE top!

Notice how the second top was not able to break the high of the first top. This is a strong sign that a reversal is going to occur because it is telling us that the buying pressure is just about finished.
With the double top, we would place our entry order below the neckline because we are anticipating a reversal of the uptrend.

Looking at the chart you can see that the price breaks the neckline and makes a nice move down. Remember that double tops are a trend reversal formation so you’ll want to look for these after there is a strong uptrend.
You’ll also notice that the drop is approximately the same height as the double top formation. Keep that in mind because that’ll be useful in setting profit targets.
Double Bottom

The double bottom is also a trend reversal formation, but this time we are looking to go long instead of short. These formations occur after extended downtrends when two valleys or “bottoms” have been formed.

You can see from the chart above that after the previous downtrend, the price formed two valleys because it wasn’t able to go below a certain level.
Notice how the second bottom wasn’t able to significantly break the first bottom. This is a sign that the selling pressure is about finished, and that a reversal is about to occur.

The price broke the neckline and made a nice move up.
See how the price jumped by almost the same height as that of the double bottom formation?
Remember, just like double tops, double bottoms are also trend reversal formations. You’ll want to look for these after a strong downtrend.
一对的组合
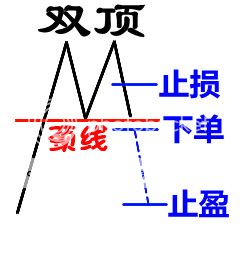
双顶(M顶)
双顶是市场反转时出现的形态,它是由价格的两次上升所形成。“顶部”是因为价格触及某阻力水平,不能突破而形成的。
当价格接触某阻力水平后,它稍微的回落,但随后又立刻返回来测试哪阻力水平。如果价格再次回落,那么你就有了 双 顶!
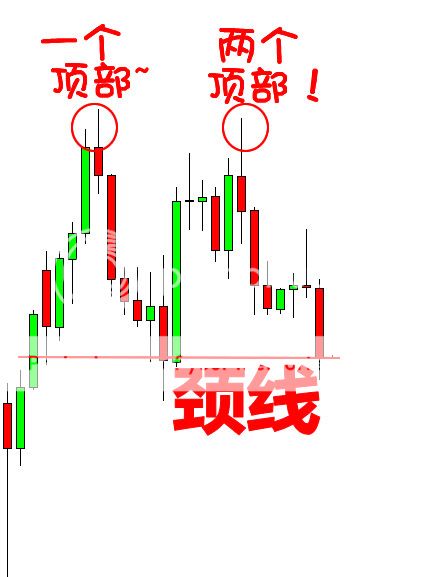
在上图中,你可以看到价格在强劲的上升中,形成了两个峰或“顶”。
注意当第二个顶部无法突破第一个顶部的高度。这是一个强烈的价格反转信号,因为它告诉了我们,买方的力量差不多耗尽了。
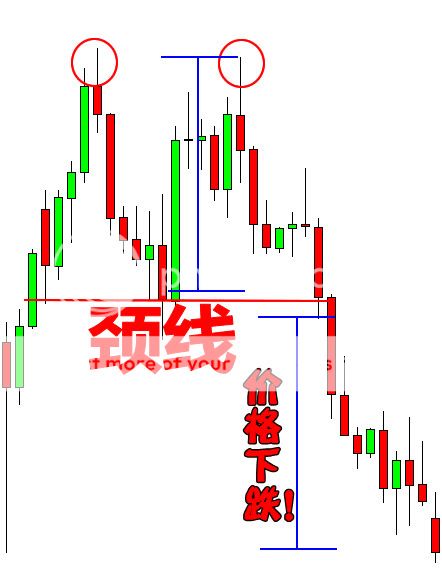
对于双顶,我们可以在颈线的下方,放置空单。因为我们将预期一个上升趋势的逆转。
哇!我们一定是拥有了特异功能还是什么特别才艺,因为我们似乎总是做对的!
你可以在图表中看到,价格突破了颈线,并且继续的下移。请记住,双顶是一个趋势反转的形态,所以在强劲的上升趋势时,你需要注意它们的出现。
您或许还会注意到,开始的下跌高度几乎和双顶形成的高度一样。记住这一点,因为这现象对我们设定止盈目标时有用。
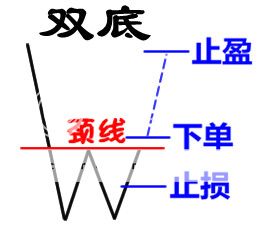
双底(W底)

双底也是一个趋势反转的形态,但这次我们是寻找做多,而不是做空的机会。这形态发生在下降趋势的末端,当两个低谷或“底部”形成的时候。
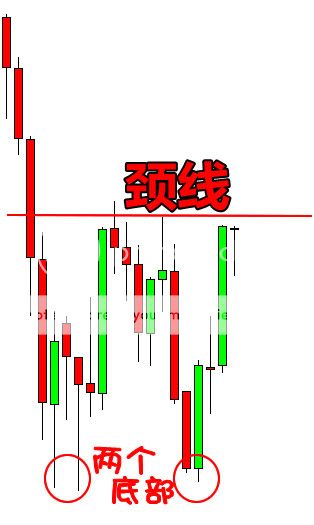
你可以从上面的图表中看到,价格在下降的趋势后,形成了两个底谷,因为它不能跌破某一支撑水平。
请注意第二个底部不能突破第一个的底部时,这是一个卖方力量快耗尽的信号,同时也是反转即将发生的信号。
你有看到这变化没!
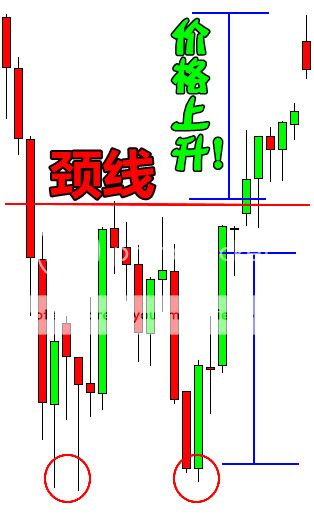
这个价格突破破了颈线,并继续的向上移动。
有注意到价格波动的高度,几乎和双底形成的高度一样吗?
记得,就像双顶一样,双底也是趋势反转的形态。在强大的跌势中,你要注意它们的出现。
How to Trade the Head and Shoulders Pattern
Head and Shoulders
A head and shoulders pattern is also a trend reversal formation.
It is formed by a peak (shoulder), followed by a higher peak (head), and then another lower peak (shoulder). A “neckline” is drawn by connecting the lowest points of the two troughs. The slope of this line can either be up or down. Typically, when the slope is down, it produces a more reliable signal.

The head is the second peak and is the highest point in the pattern. The two shoulders also form peaks but do not exceed the height of the head.
With this formation, we put an entry order below the neckline.
We can also calculate a target by measuring the high point of the head to the neckline. This distance is approximately how far the price will move after it breaks the neckline.

We know you’re thinking to yourself, “the price kept moving even after it reached the target.”
And our response is, “DON”T BE GREEDY!”
Inverse Head and Shoulders
The name speaks for itself. It is basically a head and shoulders formation, except this time it’s upside down.
A valley is formed (shoulder), followed by an even lower valley (head), and then another higher valley (shoulder). These formations occur after extended downward movements.

Our target is calculated just like the head and shoulders pattern. Measure the distance between the head and the neckline, and that is approximately the distance that the price will move after it breaks the neckline.

If your target is hit, then be happy with your profits. However, there are trade management techniques where you can lock in some of your profits and still keep your trade open in case the price continues to move your way.
You will learn about those later on in the course.
头肩形态组合
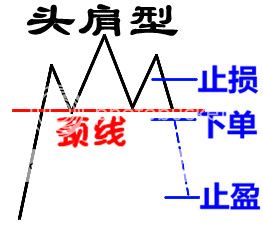
头肩型
头肩型也是一种典型的反转形态。
它是由一个高峰(肩膀),接着一个更高的高峰(头),和一个较低的高峰(肩膀)所构成。“颈线”通常是,连着两个底谷的最低点,画出的切线。 这条颈线的斜度可以是向上或向下的。 通常的情况,当颈线向下倾斜时,它会是个更可靠的反转信号。
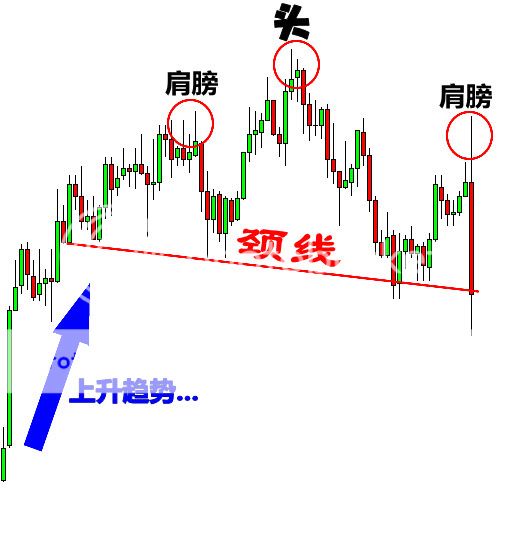
在这个例子中,我们可以简单的看出头肩型的形态。
头部是第二个高峰,它是形态中最高的高点。这两个肩膀也是由高峰形成的,但他们的高度没有超过头部的高度。
对于这种形态,我们在颈线的下面,放置空单。
我们还可以测量从头部的高点 到颈线的距离。这距离将是价格突破颈线后,大约的移动距离。
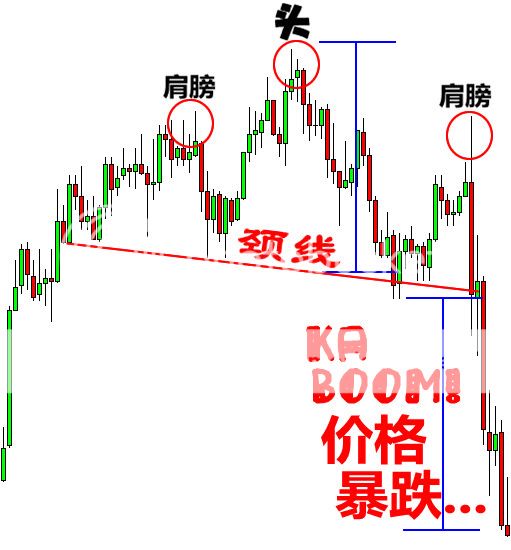
你可以看到价格一旦跌破颈线,它的移动距离,最少是从头部到颈线的距离。
我们知道你自己在想,“即便达到了目标,它也会继续下跌。”
但我们的回应是,“ 不要太贪心! “
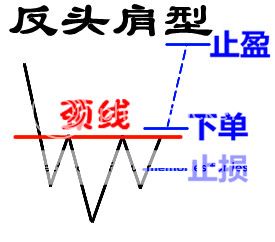
反头肩型
这名字已经告诉了你,它的形态了。它基本上也是个头肩形态,除了上下颠倒之外。
它由一个低谷凹槽和两个肩峰线构成的。它会出现跌势。
它是由一个低谷(肩膀),接着一个更低的低谷(头),和一个较高的低谷(肩膀)所构成。这形态通常发生在下跌趋势的末端
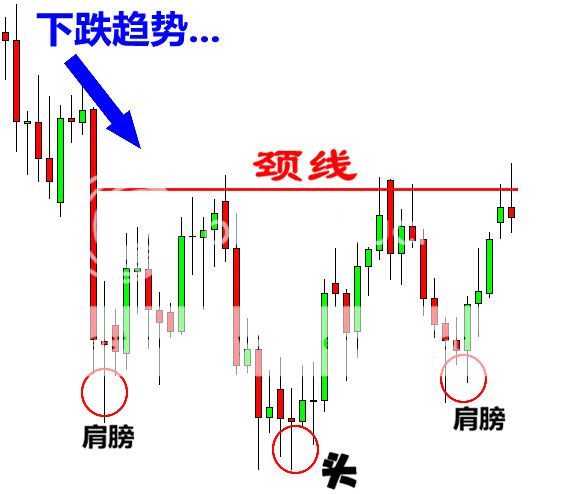
在这里你可以看到,它就像是头肩型,只是它的上下翻转了。对于这形态,我们可以在颈线的上方,放置多单。
我们的止盈目标的计算就像头肩型形一样。 测量头部到颈线之间的距离,这就是价格突破颈线后,大约的移动距离。
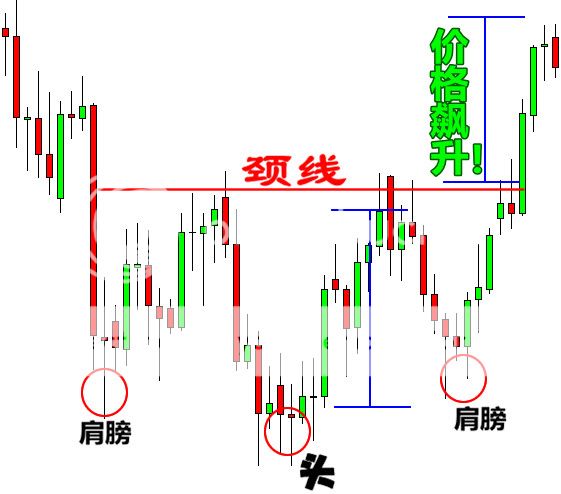
你可以看到价格打破了颈线后,漂亮的上升。
如果你达到了止盈的目标,那么你会因为赚到钱而感到高兴。但是,也有交易管理的技术,你可以锁定一部分的利润,然后继续持有部分的头寸,让价格继续慢慢往上升。
您将在后续的课程中学到这些技巧。
How to Trade Wedge Chart Patterns
Wedges signal a pause in the current trend. When you encounter this formation, it signals that forex traders are still deciding where to take the pair next.
Wedges could serve as either continuation or reversal patterns.
Rising Wedge
A rising wedge is formed when price consolidates between upward sloping support and resistance lines.
Here, the slope of the support line is steeper than that of the resistance. This indicates that higher lows are being formed faster than higher highs. This leads to a wedge-like formation, which is exactly where the chart pattern gets its name from!
With prices consolidating, we know that a big splash is coming, so we can expect a breakout to either the top or bottom.
If the rising wedge forms after an uptrend, it’s usually a bearish reversal pattern.
On the other hand, if it forms during a downtrend, it could signal a continuation of the down move.
Either way, the important thing is that, when you spot this forex trading chart pattern, you’re ready with your entry orders!

In this first example, a rising wedge formed at the end of an uptrend. Notice how price action is forming new highs, but at a much slower pace than when price makes higher lows.

See how price broke down to the downside? That means there are more forex traders desperate to be short than be long!
They pushed the price down to break the trend line, indicating that a downtrend may be in the cards.
Just like in the other forex trading chart patterns we discussed earlier, the price movement after the breakout is approximately the same magnitude as the height of the formation.
Now let’s take a look at another example of a rising wedge formation. Only this time it acts as a bearish continuation signal.

As you can see, the price came from a downtrend before consolidating and sketching higher highs and even higher lows.

In this case, the price broke to the down side and the downtrend continued. That’s why it’s called a continuation signal yo!
See how the price made a nice move down that’s the same height as the wedge?
What did we learn so far these Japanese candlestick chart patterns?
A rising wedge formed after an uptrend usually leads to a reversal (downtrend) while a rising wedge formed during a downtrend typically results in a continuation (downtrend).
Simply put, a rising wedge leads to a downtrend, which means that it’s a bearish chart pattern!
Falling Wedge
Just like the rising wedge, the falling wedge can either be a reversal or continuation signal.
As a reversal signal, it is formed at a bottom of a downtrend, indicating that an uptrend would come next.
As a continuation signal, it is formed during an uptrend, implying that the upward price action would resume. Unlike the rising wedge, the falling wedge is a bullish chart pattern.

Notice how the falling trend line connecting the highs is steeper than the trend line connecting the lows.

Upon breaking above the top of the wedge, the pair made a nice move upwards that’s approximately equal to the height of the formation. In this case, the price rally went a few more pips beyond that target!
Let’s take a look at an example where the falling wedge serves as a continuation signal. Like we mentioned earlier, when the falling wedge forms during an uptrend, it usually signals that the trend will resume later on.

In this case, the price consolidated for a bit after a strong rally. This could mean that buyers simply paused to catch their breath and probably recruited more people to join the bull camp.
Hmm, it looks like the pair is revving up for a strong move. Which way would it go?

See how the price broke to the top side and went on to climb higher?
If we placed an entry order above that falling trend line connecting the pair’s highs, we would’ve been able to jump in on the strong uptrend and caught some pips! A good upside target would be the height of the wedge formation.
If you want to go for more pips, you can lock in some profits at the target by closing down a portion of your position, then letting the rest of your position ride.
楔形形态组合
楔形是表示目前趋势停顿的一种信号。当您遇到这信号时,它表明交易者们还没决定下一步的方向该怎么走。
楔形是种整理的形态,趋势可能继续 或者 反转。
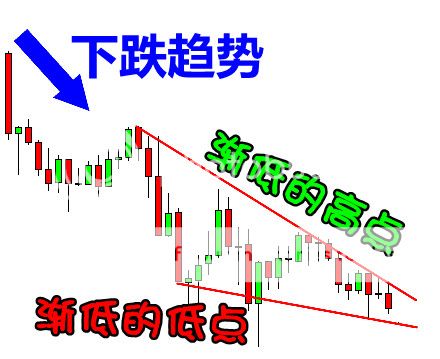
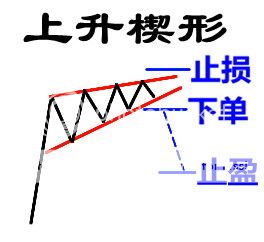
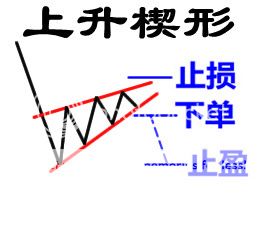
上升楔形
当价格在向上倾斜的支持和阻力线内整顿时,上升楔形就形成了。
上升楔形的 支撑线比阻力线更为陡峭。这表明,渐高的低点 比渐高的高点,形成得更快。这导致了楔子形状的形成,这正是形态名字的由来!
随着价格的整顿,我们知道,一个大的波动要来了。所以我们可以预期,在顶部 或底部,将有个突破。
如果上升楔形,是在上升趋势中形成,它通常是一个熊市反转形态。
相反地,如果它是在下跌的趋势中形成,那么它预示着价格会继续下跌。
无论怎样,最重要的动作是,当你发现它时,确保你的挂单已经设置好了!
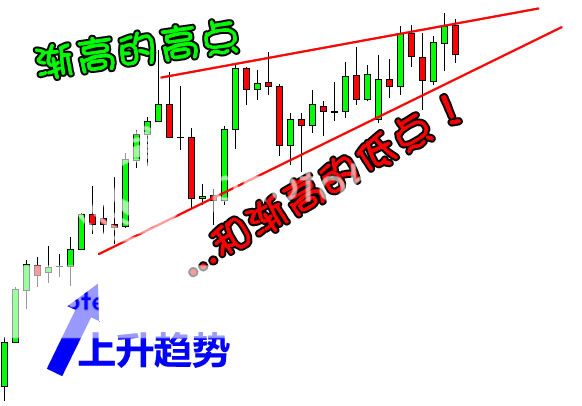
在这第一个例子中,一个上升楔形在上升的趋势末端形成。注意价格波动是如何形成新的高点,它在一段缓慢的整顿中,逐渐把价格的最低点往上移。
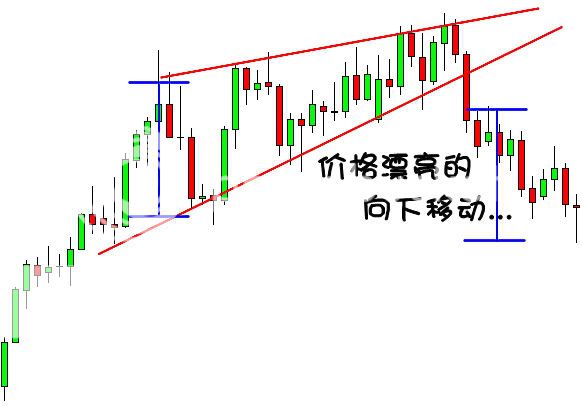
看到价格是如何突破底部的?这意味着有更多的交易者选择了做空而不是做多!
当他们把价格往下推,突破趋势线后,这表明下跌趋势几乎是已经确定了。
就像我们前面讨论过的其他图表形态,当价格突破后的大约移动距离,跟形态的高度相似。
现在让我们来看看另外一个上升楔形的例子。 只有这时候,它作为熊市持续的信号。
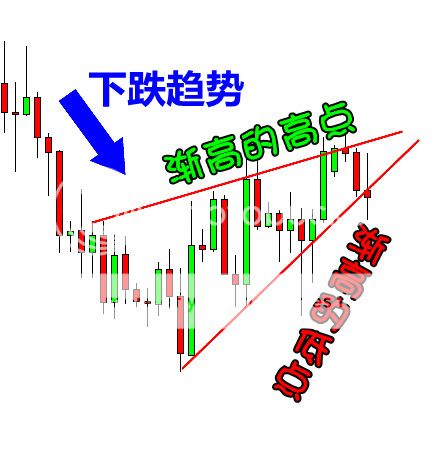
正如你看到的,价格在下跌趋势中,突然快速的向渐高的高点和渐高的低点进行整顿。
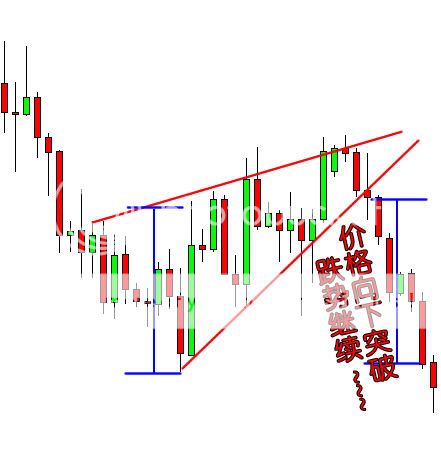
在这例子中,价格向下突破,然后持续跌势。这就是为什么它被称为熊市的延续信号哟!
看看价格是如何漂亮的移动到,和楔子形态一样的高度的?
到目前为止我们学到了什么?
一个上升楔子形态在涨势后形成,通常会导致反转(跌势);然而一个上升楔子形态在跌势中形成,通常的结果是持续的看跌(跌势)。
简单地说,上升楔形导致下跌趋势,这意味着它是一个熊市的图表形态!
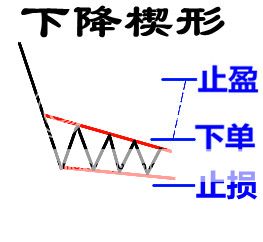
下跌楔形
就像上升楔形一样,下降的楔形也可以是一个翻转或延续的信号。
作为一个翻转信号,它通常在一段下降的趋势底部形成,表明一个上涨趋势即将来临。
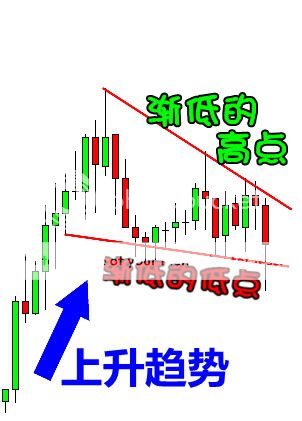
作为一个延续的信号,它通常形成于上涨趋势中,这意味着价格上升的行动将继续。 不同于上升楔形,下降楔形是种牛市的图表形态。
在这个例子中,下降楔形当做一个翻转信号。 经过一段下跌趋势后,价格会形成渐低的高点和渐低的低点。
注意看那连接高点的向下趋势线,是如何比 连接低点的趋势线,更为陡峭的。
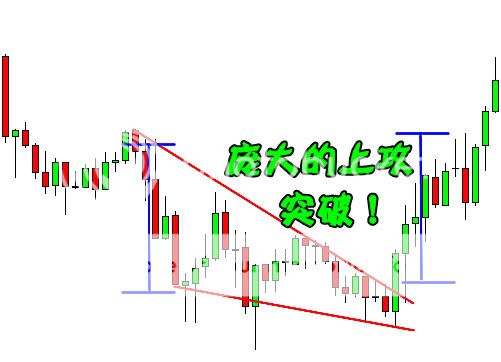
当价格突破了楔形的顶部后,货币对向上移动了大约和楔形形态高度一样的距离。在这例子中,价格的上涨超过了目标一些点数!
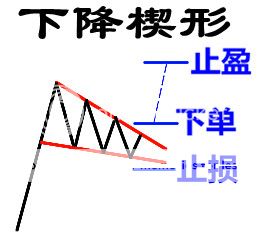
让我们再看看一个例子,一个下降楔形被当做延续信号来看的时候。就像我们前面提到的,当一个下降楔形在上涨趋势中形成时,它通常意味着该趋势将继续。
在这例子中,价格在强烈的弹起过后,稍微的整顿了一下。这可能意味着,买家只是停下来稍稍喘一口气,然后招募更多的人来加入公牛的阵营。
嗯,看起来这货币对开始强劲的波动,准备迅速的突破了。它会往哪个方向走呢?
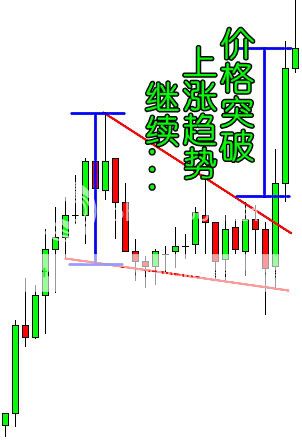
看看价格是怎样突破了形态的顶部,然后接着往上飙升的?
如果我们在连接货币对高点的,下降趋势线上面放置了订单,那么我们已经加入了这强劲的涨势,而且捞到了一些点数!一个好的上涨目标应该是楔形形态的高度。
如果你想赚更多钱,你可以在达到目标时,平掉一些仓位来锁定利润,然后让其他的头寸自由的发展。
How to Use Rectangle Chart Patterns to Trade Breakouts

A rectangle is a chart pattern formed when price is bounded by parallel support and resistance levels.
A rectangle exhibits a period of consolidation or indecision between buyers and sellers as they take turns throwing punches but neither has taken over.
The price will “test” the support and resistance levels several times before eventually breaking out. From there, the price could trend in the direction of the breakout, whether it is to the upside or downside.

Remember, when you spot a rectangle: THINK OUTSIDE THE BOX!
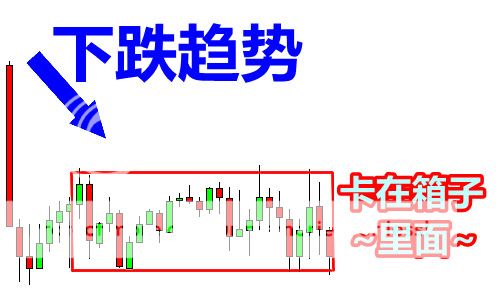
Bearish Rectangle
A bearish rectangle is formed when the price consolidates for a while during a downtrend. This happens because sellers probably need to pause and catch their breath before taking the pair any lower.


Bullish Rectangle
Here’s another example of a rectangle, this time, a bullish rectangle chart pattern. After an uptrend, the price paused to consolidate for a bit. Can you guess where the price is headed next?


Just like in the bearish rectangle pattern example, once the pair breaks, it will usually make a move that’s AT LEAST the size of its previous range.
矩形(箱形)形态组合
当价格受平行的支持和阻力位限制时,就形成了矩形形态。
矩形形态代表着一段时间,买家和卖家的整顿和犹豫不决,这期间买卖双方彼此轮流出拳,但都赢不了对方。
价格将会在数次“测试”支持和阻力位后,突破而出。那时候,价格可能会往突破的方向走一段的距离,无论是向上或向下突破时。
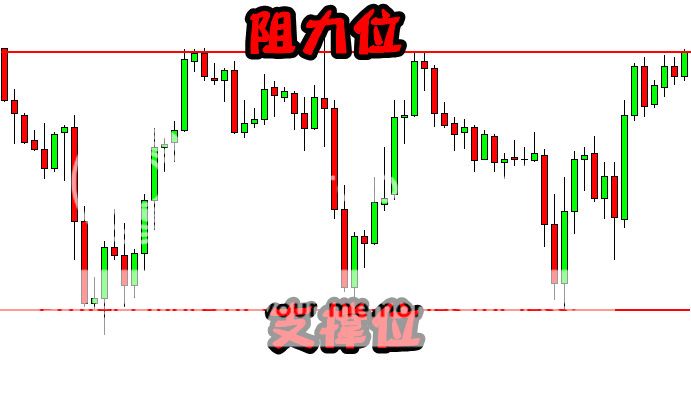
从上面的例子中,我们可以清楚地看到,货币对受两个平行的关键价位所限制的。我们只需要休息一下子,等到某一方突破价位时才去加入趋势!记住,一旦你发现一个矩形形态: 跳出盒子外去思考!
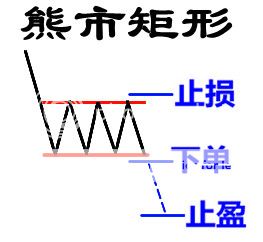
熊市矩形
一个熊市的矩形,通常在一段下跌的趋势后出现价格整理而形成。这是因为卖方可能需要停下来喘口气,然后才把货币对带到更低的价格。
在这个例子中,价格打破了矩形的底部,并继续暴跌。如果我们在支撑位的下面,有设置空单的话,我们将会在这交易中获得不错的利润。
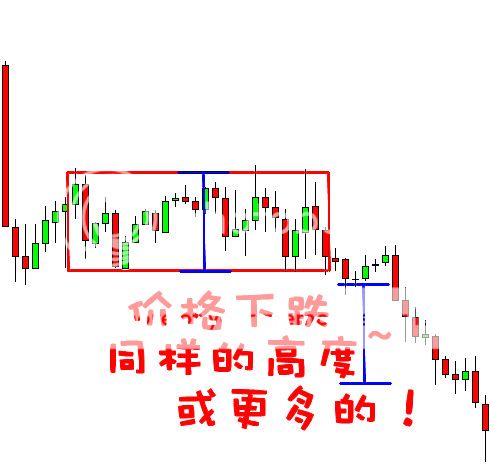
这里有一个技巧:当货币对跌破支撑位时,它一般移动的趋势长度,大约是形态的尺寸大小。上面的例子中,货币对移动的距离超越了目标,所以这将会是个得到更多点数的机会!
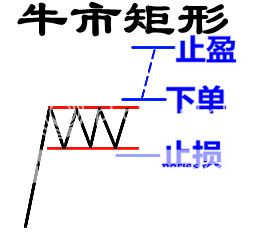
牛市矩形
这是另外一个矩形的例子,这次是牛市矩形。经过一段上升趋势后,价格会停下来整顿一下。你能猜出价格下一步会怎么走吗?
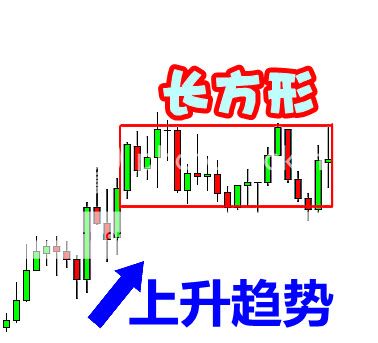
如果您的回答是上升趋势,那么你对了咯!看看在这儿发生的这些漂亮的向上突破!
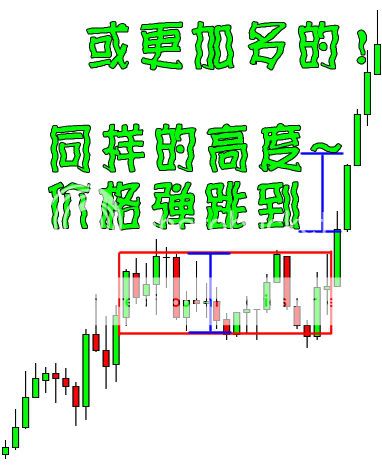
注意价格在超过矩形顶部之后,是如何扶摇直上的。如果我们在阻力位上方已经下了多单,那么我们会在这交易获得一些点数!
就像在熊市矩形的例子中一样,一旦货币对突破后,它通常的移动距离,最少会是之前形态的大小。
How to Trade Bearish and Bullish Pennants
Bearish Pennants
Similar to rectangles, pennants are continuation chart patterns formed after strong moves.
After a big upward or downward move, buyers or sellers usually pause to catch their breath before taking the pair further in the same direction. Because of this, the price usually consolidates and forms a tiny symmetrical triangle, which is called a pennant.
While the price is still consolidating, more buyers or sellers usually decide to jump in on the strong move, forcing the price to bust out of the pennant formation.
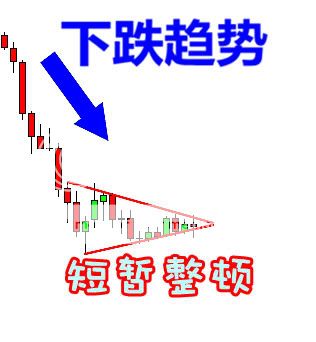
A bearish pennant is formed during a steep, almost vertical, downtrend. After that sharp drop in price, some sellers close their positions while other sellers decide to join the trend, making the price consolidate for a bit.


Unlike the other chart patterns wherein the size of the next move is approximately the height of the formation, pennants signal much stronger moves. Usually, the height of the earlier move (also known as the mast) is used to estimate the size of the breakout move.
Bullish Pennant
Bullish pennants, just like its name suggests, signals that bulls are about to go a-chargin’ again. This means that the sharp climb in price would resume after that brief period of consolidation, when bulls gather enough energy to take the price higher again.


Like we discussed earlier, the size of the breakout move is around the height of the mast (or the size of the earlier move). You see, pennants may be small in size but they could signal huge price moves so don’t underestimate ‘em!
三角旗形态组合
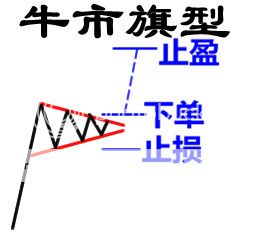
熊市的三角旗型
类似于矩形模式,旗型是市场经过的强劲的移动后,才会形成的持续形态。
经过一轮大的涨势还是跌势,买方或卖方通常会先停顿一下、喘一口气,然后才继续带领货币对往前迈进。正因为如此,价格通常会整顿形成一个微小的对称三角形,这是所谓的三角旗型。
在价格还在整顿的时候,更多的买家或卖家通常会决定加入强劲的趋势,迫使价格的整顿形成了三角旗的形态。
一个熊市的三角旗型,通常在一个陡峭、几乎垂直的下降趋势中形成。当价格急速暴跌之后,一些卖家平掉了他们的仓位;同时其他的一些卖家决定加入跌势,这造成价格出现了小整顿。
当有足够的卖家加入后,价格会突破三角旗型的底部并且继续往下移动。
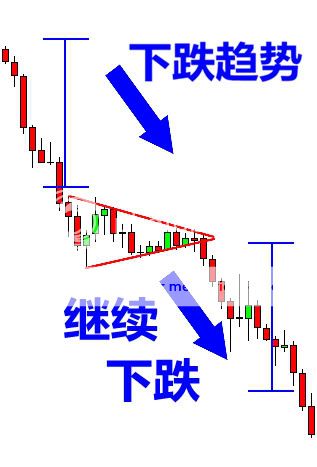
正如你看到的,当价格突破了底部后恢复下跌趋势。如果利用这形态来交易,我们会在旗型的底部设置空单,并在旗型的上部设置止损单。这样做,是为了预防跌势如果只是假象,我们可以马上退出交易。
和其他图表形态的价格移动距离不一样,三角旗型的移动幅度往往更强劲。 通常情况下,它之前移动的高度(也称为旗杆)是用来估计突破后移动的距离的。
牛市的三角旗型
牛市三角旗型,就像它的名字所暗示的那样,暗示着公牛将要再次冲刺了。这意味着,价格将在短期的整顿后继续急速的攀升,当公牛们聚集足够的能量之后,将把价格带到更高的位置。
在这个例子中,价格在垂直攀升之前,稍微喘了口气。我可以听到公牛们已经在跺脚和加速,准备另一轮趋势了!
就像我们预测的,价格突破后强劲地往上升。如何利用这个形态,我们可以把多单设置在旗型的上面,并把止损单放在旗型的底部以防止假象。
就像我们之前讨论过的,突破后移动的距离大约是旗杆的高度(或早期移动的距离)。你看,三角旗型的体积可能很小,但它们却是价格巨大波动的信号,所以不要小看了它们哦!
How to Trade Triangle Chart Patterns
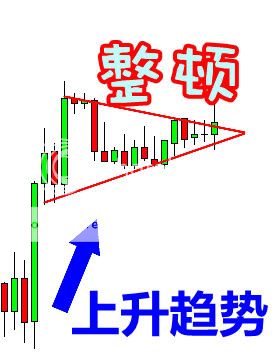
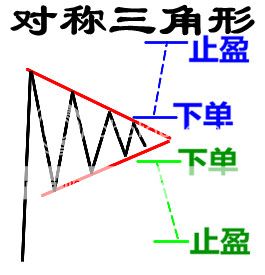
Symmetrical Triangle
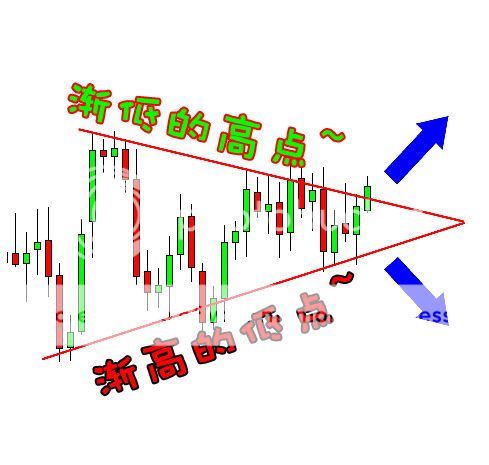
A symmetrical triangle is a chart formation where the slope of the price’s highs and the slope of the price’s lows converge together to a point where it looks like a triangle.
What’s happening during this formation is that the market is making lower highs and higher lows. This means that neither the buyers nor the sellers are pushing the price far enough to make a clear trend.
If this were a battle between the buyers and sellers, then this would be a draw.
This is also a type of consolidation.

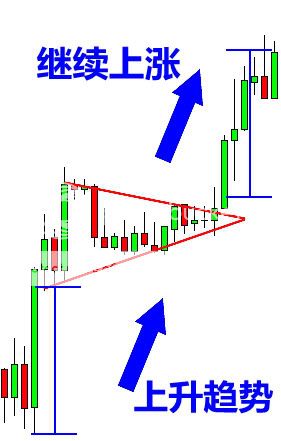
As these two slopes get closer to each other, it means that a breakout is getting near. We don’t know what direction the breakout will be, but we do know that the market will most likely break out. Eventually, one side of the market will give in.
So how can we take advantage of this?
Simple.
We can place entry orders above the slope of the lower highs and below the slope of the higher lows. Since we already know that the price is going to break out, we can just hitch a ride in whatever direction the market moves.

If you had placed another entry order below the slope of the higher lows, then you would cancel it as soon as the first order was hit.
Ascending Triangle
This type of triangle chart pattern occurs when there is a resistance level and a slope of higher lows.
What happens during this time is that there is a certain level that the buyers cannot seem to exceed. However, they are gradually starting to push the price up as evident by the higher lows.

Now the question is, “Which direction will it go? Will the buyers be able to break that level or will the resistance be too strong?”
Many charting books will tell you that in most cases, the buyers will win this battle and the price will break out past the resistance.
However, it has been our experience that this is not always the case. Sometimes the resistance level is too strong, and there is simply not enough buying power to push it through.
Most of the time, the price will in fact go up. The point we are trying to make is that you should not be obsessed with which direction the price goes, but you should be ready for movement in EITHER direction.
In this case, we would set an entry order above the resistance line and below the slope of the higher lows.

If we set our short order below the bottom of the triangle, we could’ve caught some pips off that dive.
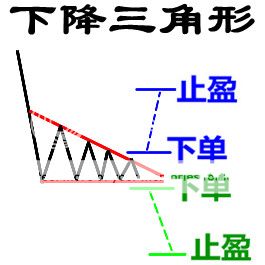
Descending Triangle
As you probably guessed, descending triangles are the exact opposite of ascending triangles (we knew you were smart!). In descending triangle chart patterns, there is a string of lower highs which forms the upper line. The lower line is a support level in which the price cannot seem to break.

Now most of the time, and we do say MOST, the price will eventually break the support line and continue to fall.
However, in some cases the support line will be too strong, and the price will bounce off of it and make a strong move up.
The good news is that we don’t care where the price goes. We just know that it’s about to go somewhere. In this case, we would place entry orders above the upper line (the lower highs) and below the support line.

Placing an entry order above the top of the triangle and going for a target as high as the height of the formation would’ve yielded nice profits.
三角形形态组合
对称三角形
一个对称三角形的形态,是由价格的高点和低点形成的斜坡,往一点聚集而成,它看起来就像一个三角形。
是什么原因造成了市场出现这种,渐高的低点和渐低的高点的形态?这形态意味着,无论是买家还是卖家都没有足够的力量,推动价格来形成明显的趋势。
如果这是买方和卖方之间的一场战争,那么这时候就是一个和局。
这是一个整顿或调整的型态。
在上图中,我们可以看到,无论是买方或卖方都不够力量推动价格的走向。当发生这种情况时,我们会看到更低的高点和更高的低点。
由于这两个斜坡逐渐接近对方,这意味着价格的突破越来越近了。我们不知道将会往什么方向突破,但我们知道,市场的爆发 即将 来临。最终,市场的其中一方将会取胜。
那么我们怎样才能利用这个形态呢?
非常的简单。
我们可以在上斜坡渐低的高点上面设置多单,或是在下斜坡渐高的低点下面设置空单。因为我们已经知道,价格即将要突破了,那么不管市场是往什么方向前进,我们都可以搭一搭顺风车。
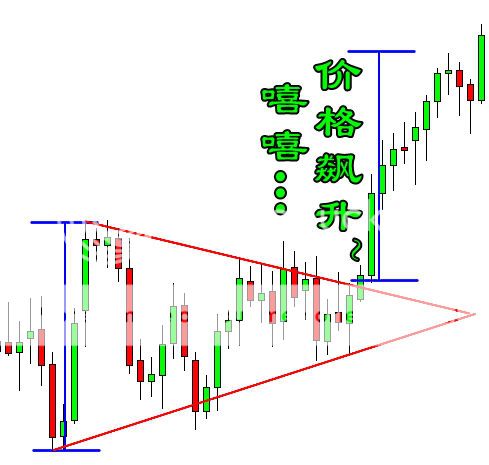
在这个例子中,如果我们在上斜坡渐低的高点上设置了多单,我们应该已经搭乘了一趟美丽的上升旅途。
如果你在下斜坡渐高的低点也设置了另一个空单的话,那么当其中一个挂单生效时,你应该马上取消另一个。
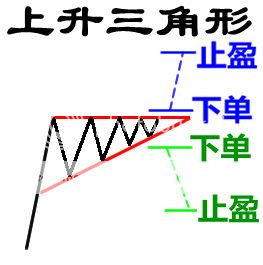
上升三角形
这形态的特征是,上面一条阻力线和渐高的低点形成的下斜线结合形成。
这段时间发生的事情是,有一条强劲的阻力线让买家多次无法超越。不过,他们又不断的推高价格,当渐高的低点越来越明显的时候就形成这形态。
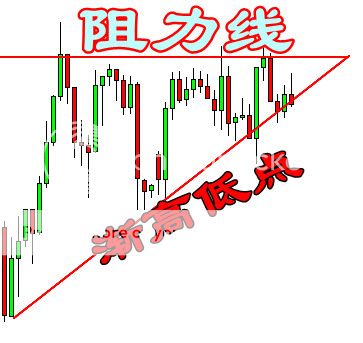
在上图中,你可以看到买家也开始发动攻势,因为他们正逐渐的抬高低点。买家们不断向那阻力位施加压力,因此一个突破势必发生。
现在的问题是?“价格会往上还是往下呢?买家是否能够突破阻力线,还是阻力线最终导致买家败下来?”
许多图表分析的书会告诉你,在大多数情况下,买家将赢得这场战争,价格将突破过去的阻力位。
然而,我们的经验却告诉我们,事实并非总是如此。有时候阻力位太强大了,买方根本就没有足够的购买力,来向上突破压力的位置。
在大多数情况下,价格确实是会升上去的。这里我们想强调的是,你不应该在乎价格往哪个方向前进,不论价格是上升还是下跌,你都应该随时在两方 做好准备。
在这例子中,我们将在阻力线上面设置多单,同时在斜的支撑线下面设置空单。
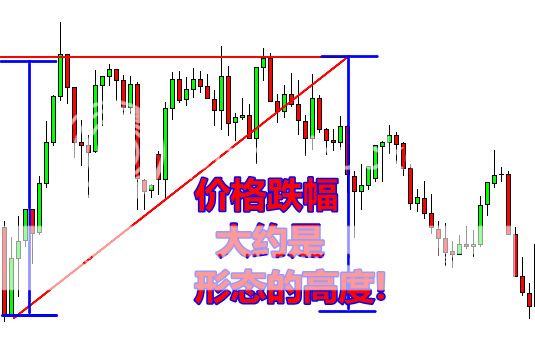
在这场战况中,买家打了败战,价格开始连续跳水!你可以看到,下跌的幅度大约是之前上升三角形形态的相同高度。
如果我们在三角形的底部设置了空单,我们可能会在这次的跳水中,获得不少的点数。
下降三角形
你可能已经猜到了,下降三角形与上升三角形是完全相反的。(我们已经知道你是聪明的!)。在下降三角形中,一串渐低的高点形成一条上斜线。下面的线是一条支撑线,阻止价格向下突破。
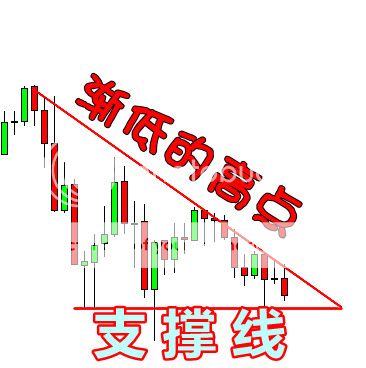
在上图中,你可以看到,价格逐渐形成渐低的高点。这告诉我们,卖家开始抢占买家的一些地盘了。
在大多数的时候,我们确实是说 大多数,价格最终将突破支撑线,然后继续下跌。
但是,在一些例子中,支撑线确实太强大了,然后价格会反弹,并激烈的向上飙升。
好的消息是,我们不必在乎价格的走势,我们只需要知道它大概突破的时候。在这例子中,我们在上斜线(渐低的高点)上面设置多单,并在支持线下面设置空单。
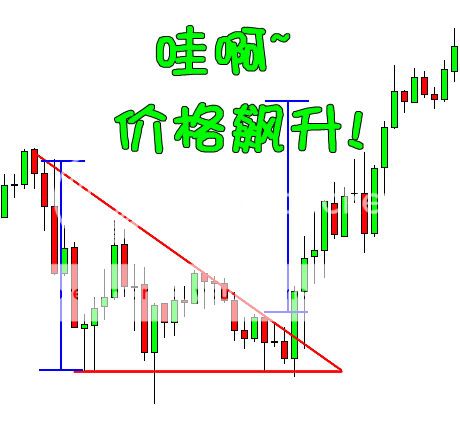
在这例子中,价格最后在三角形的尾端向上突破。突破之后,它连续的飙升,超越之前三角形形态的垂直的高度。
在三角形的斜线上面设置多单,然后在三角形形态一样的高度位置,设置止盈,将会获得很多的利润。
Know the 3 Main Groups of Chart Patterns
That’s a whole lot of chart patterns we just taught you right there. We’re pretty tired so it’s time for us to take off and leave it to you from here…
Just playin’! We ain’t leaving you till you’re ready!
In this section, we’ll discuss a bit more how to use these chart patterns to your advantage.
It’s not enough to just know how the tools work, we’ve got to learn how to use them. And with all these new weapons in your arsenal, we’d better get those profits fired up!
Let’s summarize the chart patterns we just learned and categorize them according to the signals they give.
Reversal Chart Patterns
Reversal patterns are those chart formations that signal that the ongoing trend is about to change course.
If a reversal chart pattern forms during an uptrend, it hints that the trend will reverse and that the price will head down soon. Conversely, if a reversal chart pattern is seen during a downtrend, it suggests that the price will move up later on.
In this lesson, we covered six chart patterns that give reversal signals. Can you name all six of them?
- Double Top
- Double Bottom
- Head and Shoulders
- Inverse Head and Shoulders
- Rising Wedge
- Falling Wedge
If you got all six right, brownie points for you!


To trade these chart patterns, simply place an order beyond the neckline and in the direction of the new trend. Then go for a target that’s almost the same as the height of the formation.
For instance, if you see a double bottom, place a long order at the top of the formation’s neckline and go for a target that’s just as high as the distance from the bottoms to the neckline.
In the interest of proper risk management, don’t forget to place your stops! A reasonable stop loss can be set around the middle of the chart formation.
For example, you can measure the distance of the double bottoms from the neckline, divide that by two, and use that as the size of your stop.
Continuation Chart Patterns
Continuation chart patterns are those chart formations that signal that the ongoing trend will resume.
Usually, these are also known as consolidation patterns because they show how buyers or sellers take a quick break before moving further in the same direction as the prior trend.
We’ve covered several continuation chart patterns, namely the wedges, rectangles, and pennants. Note that wedges can be considered either reversal or continuation patterns depending on the trend on which they form.


To trade these patterns, simply place an order above or below the formation (following the direction of the ongoing trend, of course). Then go for a target that’s at least the size of the chart pattern for wedges and rectangles.
For pennants, you can aim higher and target the height of the pennant’s mast.
For continuation patterns, stops are usually placed above or below the actual chart formation.
For example, when trading a bearish rectangle, place your stop a few pips above the top or resistance of the rectangle.
Bilateral Chart Patterns
Bilateral chart patterns are a bit more tricky because these signal that the price can move either way.
Huh, what kind of a signal is that?!
This is where triangle formations fall in. Remember when we discussed that the price could break either to the topside or downside with triangles?


To play these chart patterns, you should consider both scenarios (upside or downside breakout) and place one order on top of the formation and another at the bottom of the formation.
If one order gets triggered, you can cancel the other one. Either way, you’d be part of the action.
Double the possibilities, double the fun!
The only problem is that you could catch a false break if you set your entry orders too close to the top or bottom of the formation.
So be careful and don’t forget to place your stops too!
如何使用这些形态来进行交易
我们刚刚教了你一大堆的形态, 我们已经非常疲劳了,所以是时候离开一下,让你们自己练习一下了……
只是做做练习!放心,直到你做好为止,我们是不会放弃你的!
在这章节中,我们将谈论更多一些,怎样使用这些形态来增加你的优势。
只是知道这些形态的作用是远远不够的,我们必须练习如何使用它们。 配合你兵器库里的这些新武器,我们可以让盈利激增上来!
让我们总结下刚刚学习的这些图表形态,并根据它们提供的信号,来进行分类。
反转形态
反转形态是一些暗示着,目前的趋势将要改变方向的图表形态。
如果一个反转形态在上升趋势中形成,它暗示着该趋势即将发生逆转,价格很快会转向下跌。相反的,如果在一个反转形态在下降趋势中形成,它暗示着价格不久将会上升。
在这一课中,我们介绍了六个代表反转信号的图表形态。你能说出是哪六个吗?
1. 双顶 3. 头肩型 5. 上升楔形
2. 双底 4. 反头肩型 6. 下降楔形
如果你正确的说出了这六个,那么你将可以被加分!
通过这些形态来进行交易,只需要在颈线之外或在新趋势的方向中,简单地设置订单。然后在距离形态差不多高度的位置,进行止盈就行了。
举例来说,如果你看到一个双底形态,你只需要在颈线位置的上面,设置一个多单,然后在距离大约是从底部到颈线高度的地方,设置止盈目标。
根据风险管理的策略,别忘了止损单! 一个合理的止损单可设置在大约是形态高度的中间位置。
例如,您可以测量从双底到颈线的距离,再除以二,并以此作为你的停止价格。
持续形态
持续形态是一些标志着,目前的趋势只是在整顿,趋势将会继续的图表形态。
通常,它们也被称为整顿形态,因为它们显示出买方或卖方,在稍微休息后,将以更快的移动速度向之前趋势同样方向前进。
我们已经介绍了几种持续的形态,分别是楔形,矩形和三角旗形。 请注意,楔形形态同时是反转和持续形态,必须根据它们形成时的趋势来进行辨别。

使用这些形态来进行交易,只需在形态尾端的上方和下方,简单的设置订单。(当然,依照将要前进的趋势方向)。 其止盈的目标至少为楔形和矩形的大小。
对于三角旗形,你的止盈目标可以瞄在,大约是三角旗旗杆高度的位置。
对于持续形态,止损订单通常是放在形态真正形成后的上方或下方。
例如,当使用熊市矩形的形态来进行交易时,你可以把止损单设置在矩形的顶部,阻力位上方距离几点的位置。
双边形态
双边图表形态则有些棘手,因为它们暗示着,价格可以往任何方向移动。
哈,它们究竟是哪一种的形态呢 ?!
它们就是所有的三角形形态。还记得我们谈论过价格既可以在三角形的顶部突破也可以在底部突破吗?
使用这些形态来交易,你应该考虑两个情况 (向上和向下突破),并同时在底部和顶部,都设置一个订单。
如果一边的订单一旦被触发,你可以取消另一个。无论价格往哪边,你都是在趋势中的一份子。
双重的可能性,双倍的乐趣!
唯一的问题是,如果您设置的挂单过于接近顶部或底部,你会时常抓到一个假的突破。
所以,要小心,同时不要忘记了设置你的止损单!
Forex Chart Patterns Cheat Sheet

Like we promised, here’s a neat little cheat sheet to help you remember all those forex chart patterns and what they are signaling.
We’ve listed the basic forex chart patterns, when they are formed, what type of signal they give, and what the next likely price move may be. Check it out!
| Chart Pattern | Forms During | Type of Signal | Next Move |
|---|---|---|---|
| Double Top | Uptrend | Reversal | Down |
| Double Bottom | Downtrend | Reversal | Up |
| Head and Shoulders | Uptrend | Reversal | Down |
| Inverse Head and Shoulders | Downtrend | Reversal | Up |
| Rising Wedge | Downtrend | Continuation | Down |
| Rising Wedge | Uptrend | Reversal | Down |
| Falling Wedge | Uptrend | Continuation | Up |
| Falling Wedge | Downtrend | Reversal | Up |
| Bearish Rectangle | Downtrend | Continuation | Down |
| Bullish Rectangle | Uptrend | Continuation | Up |
| Bearish Pennant | Downtrend | Continuation | Down |
| Bullish Pennant | Uptrend | Continuation | Up |
You also might want to add this page to your bookmarks in case you need to double-check those chart patterns’ signals before you risk your hard-earned cash on a trade. You never know when you’re gonna need to cheat, hah! Bookmark this thing yo!
And as you probably noticed, we didn’t include the triangle formations (symmetrical, ascending, and descending) in this cheat sheet. That’s because these chart patterns can form either in an uptrend or downtrend, and can signal either a continuation or reversal. Confusing I know, but that’s where practice and experience comes in!
Like we mentioned, it’s tough to tell where the forex market will breakout or reverse. So what’s important is that you prepare well and have your entry/exit orders ready so that you can be part of the action either way!
总结各种形态

就像我们承诺过的,这里有一个简洁的小抄,它会帮你记住所有的图表形态及它们发出的信号。
我们已经列出大部分的图表形态,它们形成的时候,代表的信号,以及接下来可能的价格走势。来看看吧!
图表形态 | 形成时候 | 代表信号 | 下一步走势 |
M顶 | 上升趋势 | 翻转 | 向下 |
W底 | 下跌趋势 | 翻转 | 向上 |
头肩顶 | 上升趋势 | 翻转 | 向下 |
头肩底 | 下跌趋势 | 翻转 | 向上 |
上升楔形 | 下跌趋势 | 继续 | 向下 |
上升楔形 | 上升趋势 | 翻转 | 向下 |
下跌楔形 | 上升趋势 | 继续 | 向上 |
下跌楔形 | 下跌趋势 | 翻转 | 向上 |
看跌矩形 | 下跌趋势 | 继续 | 向下 |
看涨矩形 | 上升趋势 | 继续 | 向上 |
看跌旗型 | 下跌趋势 | 继续 | 向下 |
看涨旗型 | 上升趋势 | 继续 | 向上 |
你可能想将此页加入到您的书签当中,以备下次您可以仔细查看这些形态发出的信号,以防您辛苦交易挣来的钱丢失。
你永远不知道你什么时候需要作弊,哈哈!收藏好这东西哟!
您可能已经注意到,我们没有加上三角形态(对称,上升,下降)在这小抄内。
这是因为这些三角形态的可以在上升或下降的趋势中形成,而且同时发出可能是持续或是逆转的趋势信号。
就像我们再次提到的,形态也很难肯定的说,价格一定会在哪儿突破。
真正重要的是,你已经做好了挂单的准备,这样不管价格往哪突破,您都不会错过进场!