Trading Multiple Time Frames In Forex

What the heck is multiple time frame analysis?
Multi-time frame ana… WHAT?! Chill out young padawan, it ain’t as complicated as it sounds! You’re almost done with high school – now’s not the time to get senioritis, although you probably got that way back in Grade 12. Ha!
Multiple time frame analysis is simply the process of looking at the same pair and the same price, but on different time frames.
Remember, a pair exists on several time frames – the daily, the hourly, the 15-minute, heck, even the 1-minute!
This means that different forex traders can have their different opinions on how a pair is trading and both can be completely correct.
John may see that EUR/USD is on a downtrend on the 4-hour chart. However, Jane trades on the 5-minute chart and sees that the pair just ranging up and down. And they could both be correct!
As you can see, this poses a problem. Trades sometimes get confused when they look at the 4-hour, see that a sell signal, then they hop on the 1-hour and see price slowly moving up.
What are you supposed to do?
Stick with one time frame, take the signal and completely ignore the other time frame?
Flip a coin to decide whether you should buy or sell?
Luckily for you, we here at BabyPips.com aren’t about to let you graduate without knowing how to use multiple time frame analysis to your advantage.
First, we’ll try to help you determine which time frame you should focus on. Each forex trader should trade a specific time frame that fits his or her own personality (more on this later).
Secondly, we’ll also teach you how to look at different time frames of the same currency pair to help you make better, more educated trading decisions.
多重时间框架分析

多重时间框架分析是什么鬼东西?
多重时间框 吖……什么?!年轻的绝地学徒,冷静点先,它并不像听起来那么的复杂!你已经快顺利完成高中的学业了—但现在可还不是患上高年级倦怠症的时候,虽然你可能早在前几课就有这症状了,哈哈!
多重时间框架的分析,简单的说,就是在不同的时间框架中,分析同样的货币对和同样的价位。
记住,货币对的价格是同时存在于,几个不同时间的框架中:日的、小时的、15分钟的,还多各种时段的,甚至是1分钟的!
这意味着同一种货币对,不同的交易者会有不同的看法,并且这些看法都是完全正确的。
菲比可能在4小时的走势图上,看到欧元/美元处于下跌趋势中。然而,山姆根据5分钟的走势图,却只看到这货币对在上下的震荡盘整。但是他们双方的看法,可能都是正确的!
就像你已经注意到的,这儿出现了一个问题。交易者们有时候会感到相当的困惑,当他们在一个4小时的走势图上看到一个卖出的信号,然后他们再查看1小时的走势图时,却看到价格正在慢慢的上升中。
那么你应该怎么办呢?
是否应该坚持只用一种时间框架,来获取做单的信号,然后完全的忽略其他时间框架?
还是应该抛一个硬币来决定,你应该买进还是卖出?
对你来说幸运的是,在我们BabyPips这里,并不会让你在不懂得如何运用,多重时间框架的分析来提高你的优势前,就随便让你你毕业的。
首先,我们会帮助您确定,哪个时间框架是你应该专注的。每一个交易者都必须在一个,符合他或她自己个性的时间框架上,来进行交易(后面会介绍)。
接下来,我们会教你如何观察,同一种货币对在不同时间框架中的走势,从而让你可以做出更好、更明智的交易判断。
What Time Frame Should I Trade?
One of the reasons newbie forex traders don’t do as well as they should is because they’re usually trading the wrong time frame for their personality.
New forex traders will want to get rich quick so they’ll start trading small time frames like the 1-minute or 5-minute charts. Then they end up getting frustrated when they trade because the time frame doesn’t fit their personality.

This time frame is longer, but not too long, and trade signals are fewer, but not too few. Trading on this time frame helps give more time to analyze the market and not feel so rushed.

It would be way too slow for him and he’d probably think he was going to rot and die before he could get in a trade. He prefers trading a 10-minute chart. It still gives him enough time (but not too much) to make decisions based on his trading plan.
Another buddy of ours can’t figure out how forex traders trade on a 1-hour chart because he thinks it’s too fast! He trades only daily, weekly, and monthly charts.
Okay, so you’re probably asking what the right time frame is for you.
Well buddy, if you had been paying attention, it depends on your personality. You have to feel comfortable with the time frame you’re trading in.
You’ll always feel some kind of pressure or sense of frustration when you’re in a trade because real money is involved. That’s natural.
But you shouldn’t feel that the reason for the pressure is because things are happening so fast that you find it difficult to make decisions or so slowly that you get frustrated.
When we first started trading, we couldn’t stick to a time frame.
We started with the 15-minute chart.
Then the 5-minute chart.
Then we tried the 1-hour chart, the daily chart, and the 4-hour chart.
This is natural for all new forex traders until you find your comfort zone and why we suggest that you DEMO trade using different time frames to see which fits your personality the best.
我该用什么时间的框架来交易?
“菜鸟级”的交易者们,之所以交易的不太理性,其中一个主要的原因是,他们通常使用着,不适合他们自己性格的时间框架,来进行交易。
交易新手们由于想要迅速致富,因此他们一般会使用,较小的时间框架来进行交易,例如1分钟或者5分钟的框架图表。之后他们往往会对自己交易的结果,感到失望和挫折,因为他们选择了根本不符合自己个性的时间框架来交易。
对于一些交易者来说,他们使用1小时框架图表来交易,会觉得很舒适。
这个时间框架是比较长,但也不是太长,交易的信号比较少,但也不会太少。在这个时间框架上进行交易,会让交易者有更多的时间,去分析市场的信息,并且不会感觉很匆忙。

然而在另一边,我们有些朋友虽然曾用过1小时框架,但应该再也不可能使用1小时的框架来进行交易。
这种框架对于这一些人来说,太过于缓慢,以至于让他们觉得,在获得一个交易讯号之前,自己已经等待得腐烂到快死去了。他们更偏向于使用10分钟的图表。这虽然也可以给予了他足够的时间(但不会太长),根据自己的交易计划来思考决策。
我们另一些的伙伴,却想不出那些交易者们,是如何在1小时的图表上做交易的,他们觉得节奏太快了!他们只在日、周、和月的图表上进行交易。
好吧,这下你可能要问,最适合你的,是哪种时间的框架了。
好伙伴,如果你真的认真看了上面这些,应该已经知道,这完全取决于你自己的个性。你必须对你交易时,使用的时间框架,感到舒适。
当你在使用真金白银进行交易时,自己总会觉得有某种压力或挫折感,这是正常的事。
但你的压力不应该来至,因为一切发生得太快,导致你难以做出决定;或是一切进行得太慢,而令你感到沮丧。
当我们首次进行交易的时候,我们不能死坚持着某个时间的框架。
我们先由15分钟图表开始。
然后试看5分钟图表。
跟着尝试1小时图表、日图表,和4小时图表等。
这对所有的交易新手来说,是正常的事。直到你找到,适合自己的时间框架。这就是为什么,我们建议您在不同的时间框架,使用 模拟 的交易,去发现哪一个框架最适合你自己。
What Time Frame Is Best for Trading?
Well, just like everything in life, it all depends on YOU.
Do you like to take things slowly, take your time on each trade? Maybe you’re suited for trading longer time frames.
Or perhaps you like the excitement, quick, fast paced action? Perhaps you should take look at the 5-min charts.
In the table below, we’ve highlighted some of the basic time frames and the differences between each.
| Time Frame | Desciption | Advantage | Disadvantages |
|---|---|---|---|
| Long-term | Long-term traders will usually refer to daily and weekly charts.The weekly charts will establish the longer term perspective and assist in placing entries in the shorter term daily.Trades usually from a few weeks to many months, sometimes years. | Don’t have to watch the markets intradayFewer transactions mean less times to pay the spreadMore time to think through each trade | Large swingsUsually 1 or 2 two goods a year so PATIENCE is required.Bigger account needed to ride longer term swings Frequent losing months |
| Short-term (Swing) | Short-term traders use hourly time frames and hold trades for several hours to a week. | More opportunities for tradesLess chance of losing monthsLess reliance on one or two trades a year to make money | Transaction costs will be higher (more spreads to pay)Overnight risk becomes a factor |
| Intraday | Intraday traders use minute charts such as 1-minute or 15-minute. Trades are held intraday and exited by market close. | Lots of trading opportunitiesLess chance of losing monthsNo overnight risk | Transaction costs will be much higher (more spreads to pay)Mentally more difficult due to the need to change biases frequentlyProfits are limited by needing to exit at the end of the day. |
You also have to consider the amount of capital you have to trade.
Shorter time frames allow you to make better use of margin and have tighter stop losses.
Larger time frames require bigger stops, thus a bigger account, so you can handle the market swings without facing a margin call.
The most important thing to remember is that whatever time frame you choose to trade, it should naturally fit your personality.
If you feel a little uptight like your undies are loose or your pants are little too short, then maybe it’s just not the right fit.
This is why we suggest demo trading on several time frames for a while to find your comfort zone. This will help you determine the best fit for you to make the best trading decisions you can.
When you finally decide on your preferred time frame, that’s when the fun begins. This is when you start looking at multiple time frames to help you analyze the market.
什么时间框架适合交易
嗯,这就像生活里的所有事一样,一切取决于你。
你做事情是否喜欢一步步慢条斯理的,愿意花多点时间在每一单交易上?那也许你适合,使用长时限的框架来进行交易。
或者,你是喜欢刺激感,迅速、快节奏的拍子?那么你应该尝试一下5分钟的图表。
在下面的表格中,我们已经列出了一些基本的时间框架,以及它们之间彼此的不同。
时间框架 | 描述 | 优点 | 缺点 |
长 期 | 长期交易者们,通常是使用日图表和周图表。 周框架的图表帮助建立长远的角度,并在短期的日图表内,找出进场的位置。 这类交易通常,从几周跨越到几个月,有时候甚至是几年。 | 不需要每天紧盯着日内市场。 较少的交易,意味着较少的情绪影响、较少的时间精力,和较少的点差支付。 可以用更多的时间去深入思考每一笔交易。 | 大幅的波动 通常一年只交易1到2单,因此耐心不可少。 越大的账户,需要越长期的漂单。 亏损有时长达数月。 |
短期 (波段) | 短期交易者们,使用小时计算的框架,并持仓几个小时到一个星期之间。 | 更多的交易机会。 很少出现月度的亏损。 减少对那一年中的,1、2次挣钱交易的依赖。 | 交易费用较高(支付更多的交易点差)。 隔夜成为一种风险。 |
日内 | 日内交易者们,使用分钟计算的图表,如1分钟或15分钟。 交易者们坚持只在日内交易的作法,并不持仓过夜。 | 大把的交易机会。 很少出现月度的亏损。 无过夜的风险 | 交易费用最高(支付更多的交易点差) 由于需要频繁改变对趋势的看法,精神和心理上的压力会更大。 因为仓位要在一天结束时关闭,利润受到限制。 |
你同时还必须考虑,你交易时,账户内拥有的金额。
较短的时间框架,可以让你更好地利用保证金杠杆,同时有助于你迅速的止损。
较长的时间框架,要求更大的止损,也就是更大的账户资金,这样你才可以捕抓到市场的大波动,而不会面对爆仓的窘境。
要记得的最重要事情是,不管你选择了什么样的时间框架去交易,它应该完全适合你的个性。
如果你感觉有点焦躁,就像你的内衣太松或你的内裤太紧,那么也许只是它不适合你而已。
这就是为什么我们建议你,先在几种不同的时间框架之间,模拟交易一段时间,从而找到适和你的时间框架。这将帮助你找到最合适你的方式,去做出最好的交易决策。
当你最后决定了,你所钟爱的时间框架后,那么交易的乐趣也就开始了。这也是时候,开始让你学习运用多个时间框架,来帮助你分析市场了。
Why You Should Look at Multiple Time Frames When Trading Forex
Before we explain how to do multiple time frame analysis for your forex trading, we feel that it’s necessary to point out why you should actually flip through the different time frames.
After all, isn’t it hard enough analyzing just one chart as a forex trader?
You’ve got a billion indicators on, you’ve gotta read up on economic news, you’ve got basketball practice, a Call of Duty session, a hot date at McDonald’s…
Well, let’s play a game called “Long or Short” to show why you should be paying attention and putting in the extra effort to look at different time frames.
The rules of the game are easy. You look at a chart and you decide whether to go long or short. Easy, right? Okay, ready?
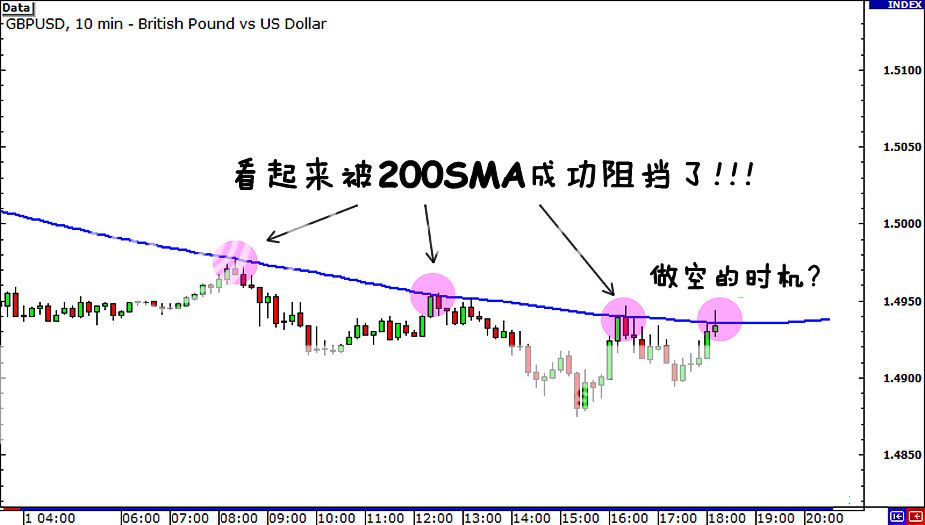
Let’s take a look at the 10 minute chart of GBP/USD on July 1, 2010 (7/01/2010) at 8:00 am GMT. We’ve got the 200 simple moving average on, which appears to be holding as resistance.
With price testing the resistance and forming a doji, it seems like a good time to short right?
We’ll take that as a yes.

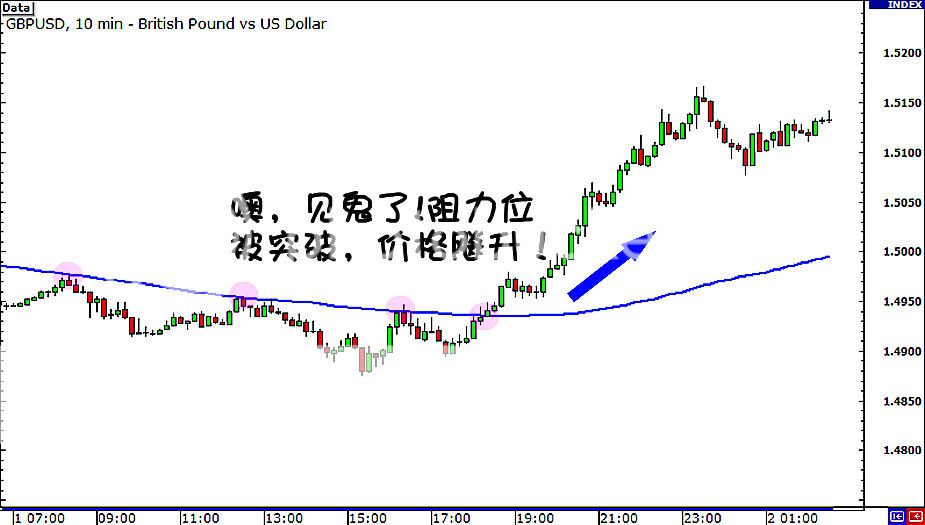
But dang, look what happens next!
The pair closed above resistance and rose another 200 pips!
Ouch! Oh well, too bad!

What the hell happened? Hmm, let’s hop on to the 1-hour chart to see what happened…
If you had been looking at the one hour chart, you would have noticed that the pair was actually at the bottom of the ascending channel.
What’s more, a doji had formed right smack on the support line! A clear buy signal!

The ascending channel would have been even clearer on the 4-hour chart.

If you had looked at this chart first, would you still have been so quick to go short when you were trading on the 10-minute chart?
All of the charts were showing the same price data. They were just different time frames of that same data.
Check out another example of multiple time frame analysis in our forums.
Do you see now the importance of looking at multiple time frames?
We used to just trade off the 15-minute charts and that was it.
We could never understand why when everything looked good the market would suddenly stall or reverse. It never crossed our minds to take a look at a larger time frame to see what was happening.
When the market did stall or reverse on the 15-minute chart, it was often because it had hit support or resistance on a larger time frame.
It took a couple hundred negative pips to learn that the larger the time frame, the more likely an important support or resistance levels would hold.
Trading using multiple time frames has probably kept us out of more losing trades than any other one thing alone. It will allow you to stay in a trade longer because you’re able to identify where you are relative to the big picture.
Most beginners look at only one time frame. They grab a single time frame, apply their indicators and ignore other time frames.
The problem is that a new trend, coming from another time frame, often hurts forex traders who don’t look at the big picture.
为何你需要结合多个时间框架交易外汇
在我们解释如何使用,多重的时间框架来分析之前,我们觉得应该指出,为什么你还需要浏览,不同时间的框架。
毕竟,只是分析一个图表,已经是够难的了,不是吗?
为了分析一个图表,你已经加上了十亿个指标,你也读了经济新闻,同时像篮球训练一样时常下单,情绪像战争一样处在使命召唤,每日准时到麦当劳报道。。。
好吧,让我们再玩一个叫做“做多还是做空”的游戏,来示范为什么你要更加的注意,同时更加的努力,来查看这些不同时间的框架。
这游戏的规则很简单。你先看一个图表,然后决定是做多还是做空,很简单吧?好了吗,开始了喔?
让我们看看英镑/美元的10分钟图表,就在2010年7月1日,美国东部时间8am。我们已经加上了100期的简单移动平均线,用它来作为阻力或支撑。
随着价格上升到平均线,开始测试阻力,并形成十字星,这看起来是一个很好的做空机会吧?
我们就姑且先当你,是这样认为吧。
但是见鬼了,看看接下来发生了什么事!
该货币对迅速飞升了200多点后,在阻力位的上方收盘!
喔!哎呦,太糟糕了!
怎么会发生这种破烂事啊?让我们跳到1小时,更大的框架去查看发生了什么状况。。。
如果你一直在看着1小时的图表,你应该注意到该货币对,实际上是在一个上升通道的底部。
更重要的是,一支蜡烛已经在支撑线形成明显的十字星!这是一个明确的买进信号!
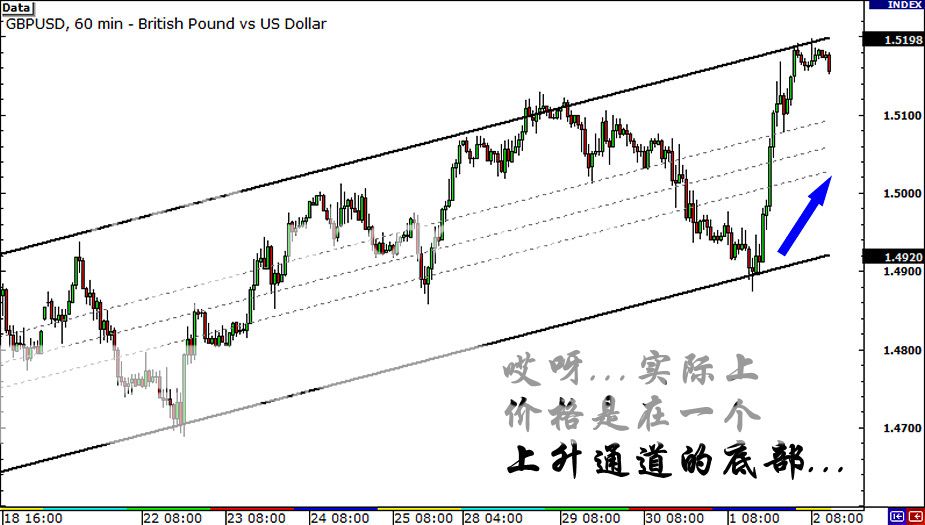
在4个小时的图表中,更清晰的显示出价格是在一个上升通道中。
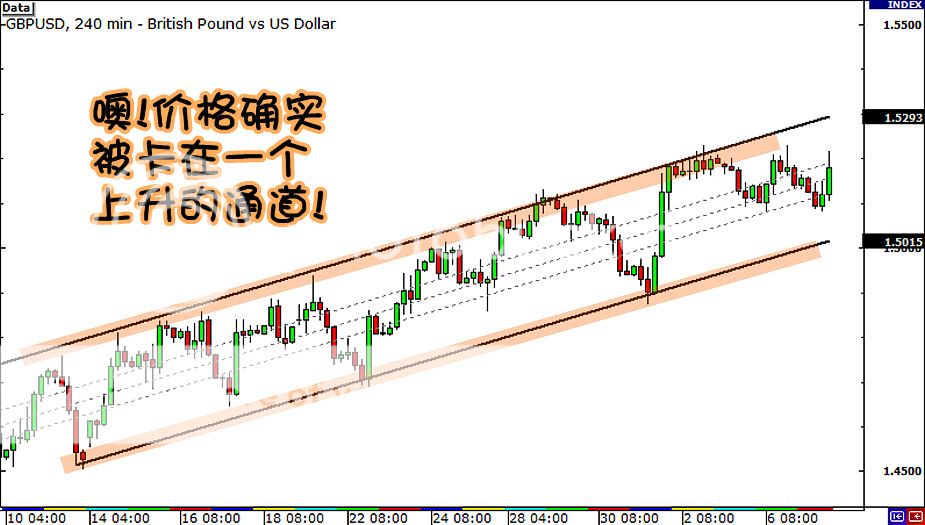
如果你有先查看这个图表,当你在使用10分钟图表来交易的时候,你还会很快就下单吗?
上面的这些所有图表,都是在同样的一天和时间,它们只是使用了不同的时间框架。
现在你知道了,要查看多个时间框架的重要性了吧?
过去,我们可能只是在15分钟的图表上进行分析,然后就肯定的下单了。
这导致我们可能永远都不会明白,为什么一个看起来那么牛的市场,会突然失速或反转。也许我们没有意识到,必须在更大的时间框架中,看看发生了什么事。
当市场在15分钟的图表上,出现失速或反转时,通常是因为它在更大的时间框架中,遇到了支持或阻力。
这将让你在花费了几百个亏损的点子后,学会越大的时间框架,它的支撑和阻力位越重要的。
同使用一个时间框架相比,应用多个时间框架肯定可以,让我们减少交易失败的亏损。多重时间框架让你可以持有一个头寸较长的时间,因为你已经能够识别出你下单的价位和宏观蓝图之间的关系。
大多数初学者,只是仅仅查看一个时间框架。他们紧盯着单一的时间框架,运用着他们的指标,而忽略了其他时间的框架。
问题是一个新的趋势,多数是由另一个时间框架所产生的。而这个新趋势,常常会伤害那些,忽略大局的交易者们。
How to Do Multiple Time Frame Analysis to Find Better Entry and Exit Points

No, we aren’t about to break out into song like the Glee cast.
Here at BabyPips.com, we’ve got our version of a mash-up, which we like to call the “Time Frame Mash-up”.
This is where multiple time frame analysis comes in to play.
This is where we’ll teach you how to not only lock in on your preferred trading time frame, but zoom in and out of charts so that you can knock a winner out of the park.
You ready? You sure you can hack this? You’ve basically got a semester left of BabyPips.com High School of Pipsology?
You don’t wanna quit now do you?
Didn’t think so!
First of all, take a broad look at what’s happening.
Don’t try to get your face closer to the market, but push yourself further away.
You have to remember, a trend on a longer time frame has had more time to develop, which means that it will take a bigger market move for the pair to change course. Also, support and resistance levels are more significant on longer time frames.
Start off by selecting your preferred time frame and then go up to the next higher time frame.
There you can make a strategic decision to go long or short based on whether the market is ranging or trending. You would then return to your preferred time frame (or even lower!) to make tactical decisions about where to enter and exit (place stop and profit target).
Just so you know, this is probably one of the best uses of multiple time frame analysis – you can zoom in to help you find better entry and exit points. By adding the dimension of time to your analysis, you can obtain an edge over the other tunnel vision traders who trade off on only one time frame.
Did you get all of that? Well, if you didn’t, no worries – we’re gonna go through an example now to help make things a little clearer.
How to Perform Multiple Time Frame Analysis
Let’s say that Cinderella, who gets bored all day cleaning up after her evil step sisters, decides that she wants to trade forex.
After some demo trading, she realizes that she likes trading the EUR/USD pair the most, and feels most comfortable looking at the 1-hour chart. She thinks that the 15-minute charts are too fast while the 4-hour take too long – after all, she needs her beauty sleep.
The first thing that Cinderella does is move up to check out the 4-hour chart of EUR/USD. This will help her determine the overall trend.

She sees that the pair is clearly in an uptrend.
This signals to Cinderella that she should ONLY be looking for BUY signals. After all, the trend is her friend, right? She doesn’t want to get caught in the wrong direction and lose her slipper.
Now, she zooms back to her preferred time frame, the 1-hour, to help her spot an entry point. She also decides to pop on the stochastic indicator.

Once she goes back down to the 1-hour chart, Cinderella sees that a doji candlestick has formed and the stochastic has just crossed over out of oversold conditions!
But Cinderella still isn’t quite sure – she wants to make sure she has a really good entry point, so she scales down to the 15-minute chart to help her find an even better entry and to give her more confirmation.

So now Cinderella is locking her eyes in on the 15-minute chart, and she sees that the trend line seems to be holding pretty strongly. Not only that, but stochastic are showing oversold conditions on the 15-minute time frame as well!
She figures that this could be a good time to enter and buy. Let’s see what happens next.

As it turns out, the uptrend continues, and EUR/USD continues to rise up the charts.
Cinderella would have entered just above 1.2800 and if she had kept the trade open for a couple of weeks, she would have made 400 pips! She could have bought another pair of glass slippers!
There is obviously a limit to how many time frames you can study. You don’t want a screen full of charts telling you different things.
Use at least two, but not more than three time frames because adding more will just confuse the geewillikers out of you and you’ll suffer from analysis paralysis, then proceed to go crazy.
Is there a wrong way to do multiple time frame analysis, you ask? Some of our forex friends have been nice enough to give their two cents on this matter through this forum thread on multiple time frame analysis. At the end of the day, it really is all about finding what works best for you.
利用多重时间框架寻找进出场位

欢迎回到我们的课堂,我们将推出最新版本的混搭,我们把它称作“时间框架混搭”。
所谓“时间框架混搭”,就是对多重时间框架或不同时间框架进行分析。
这意味着,我们将教你,如何做到不仅只是关注你所偏好的交易时间框架,也应该关注更长期时间框架和更短期时间框架,只有这样,你才可以在交易中胜出。
准备好了吗?你确定可以做到这点吗?你已经学习了本系列课程的一半,你不想就此放弃,是吧?
首先,你对市场的运行态势应该有一个总体的把握。
不要将你的脸过分的贴近市场,你需要和市场先保持一段距离。
你必须记住,在长期框架内的某一趋势需要更长的时间形成,这意味着汇价走势的改变需要更大的市场波动配合。同时,支撑和阻力位在长期时间框架内的稳定性也更强。
在选择好你所偏好的时间框架后,你应该关注更长期时间框架内的价格走势。
在更长的时间框架图形上,你可以基于市场是处于趋势运行或是区间运行来做出相应的做多或是做空决定。随后,你再次转向你所偏好的时间框架(或更短期时间框架),以确定你的入场和退出策略(设置止损和获利目标)。
如你所知,这很会可能是多时间框架分析的最佳使用方法——你可以通过对短时间框架图形的分析来确定你的入场和出场点位。而对更长时间框架图形的分析,你可以获得那些只关注单一时间维度的交易者所不曾好获得的更加广阔的交易视角。
你都明白了吗?如果你还没明白,不要紧,我们将举例帮助你把事情了解得更清楚。
听过灰姑娘的故事吧?假设灰姑娘厌倦了每天都在家打扫清洁的生活,并决定开始做外汇交易。
在经过一段时间的模拟交易后,她认识到她最喜欢交易欧元/美元,而她也最愿意在1小时图上进行交易。她认为15分钟图变动太快,而4小时图变动又太慢——毕竟,她需要充足的睡眠来保持她美丽的容貌。
灰姑娘首先做的事是观察欧元/美元4小时图。这将帮助她确定汇价的总体趋势。
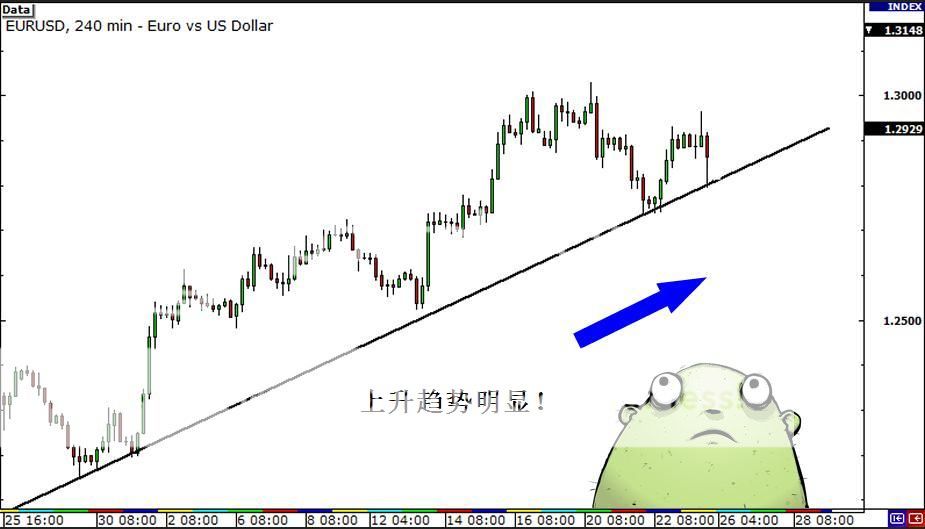
她发现,欧元/美元处于明显的上升趋势中。
这一信号表明,灰姑娘要做的仅仅只是找到买入信号,毕竟,趋势是她最好的朋友,对吧?
现在,她再次回到她个人所偏好的时间框架——1小时图上,这将帮助她确定入场点位,在做出交易决定之前,她也会借助随机指标的帮助。
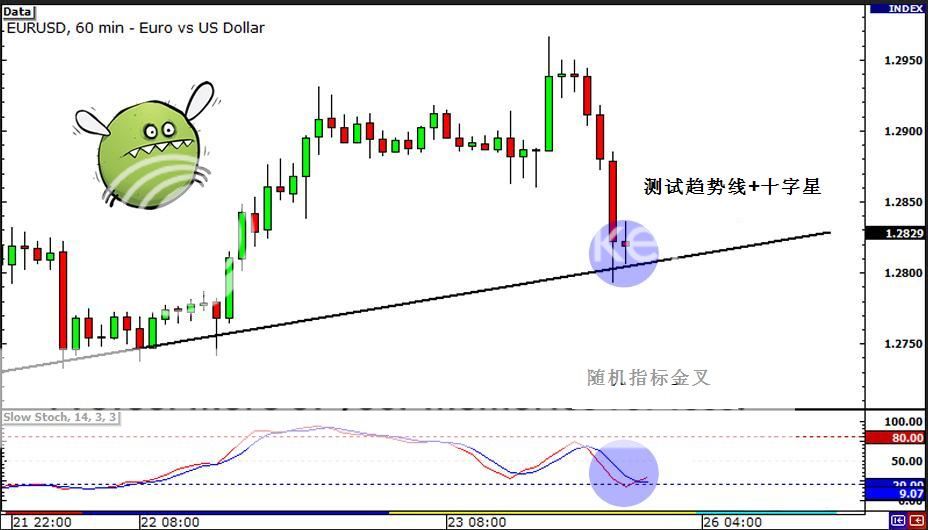
当灰姑娘打开1小时图时,她发现欧元/美元已形成十字星,而且随机指标已经在超卖区域形成金叉!
但是,灰姑娘仍然不是十分确定——她想要进一步确定她已经找到良好的入场点位,所以,她打开15分钟图形,以帮助她获得更加好的入场点位,并给她更多的确认信息。
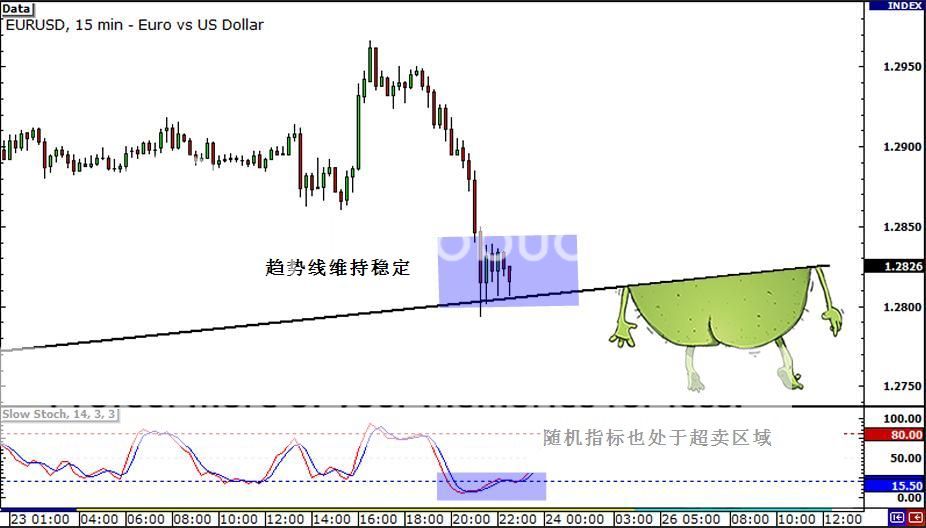
现在,灰姑娘将她的注意力全部集中在15分钟图上,她发现,趋势线相当的稳定。不仅如此,随机指标在15分钟图上也显现出超卖状态!
由此,灰姑娘得出结论,这可能是一个不错的进场买入机会。现在,让我们看看,接下来发生了什么。
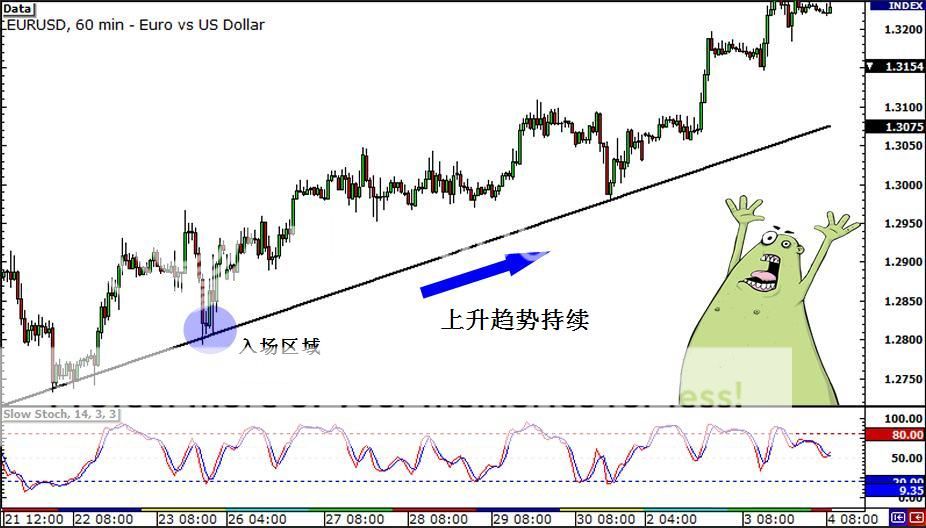
正如随后看到的,欧元/美元上升趋势在继续,且汇价在小时图上继续走高。
如果灰姑娘在1.2800上方入场,且如果她在未来数周持有这张单子,她的获利将达到400点。她也可能买了一双新的水晶鞋!
对于你应该对多少时间框架内的图形进行研究,也应该有个限度。你也不想看到,在一个布满图形的屏幕上,这些图形向你发出的都是不同的交易信息吧。
我们的建议是,至少观察两个时间框架下的图形,最多不超过三个,因为你观察的不同时间框架图形越多,你的困惑也会越大,这样,你的分析将会陷入停顿,你也将走向疯狂。
Trading With Three Time Frames

Here at the BabyPips.com School of Pipsology, we like using three time frames. We feel that this gives us the most flexibility, as we can decipher the long, medium and short term trends.
The largest time frame we consider our main trend – this shows us the big picture of the pair we wanna trade.
The next time frame down is what we normally look at, and it signals to us the medium term buy or selling bias.
The smallest time frame shows the short term trend and helps us find really good entry and exit points.
You can use any time frame you like as long as there is enough time difference between them to see a difference in their movement.
You might use:
- 1-minute, 5-minute, and 30-minute
- 5-minute, 30-minute, and 4-hour
- 15-minute, 1-hour, and 4-hour
- 1-hour, 4-hour, and daily
- 4-hour, daily, and weekly and so on.
When you’re trying to decide how much time in between charts, just make sure there is enough difference for the smaller time frame to move back and forth without every move reflecting in the larger time frame.
If the time frames are too close, you won’t be able to tell the difference, which would be pretty useless.
时间框架组合

我们喜欢使用三重时间框架,因为通过三重时间框架分析,我们能够对汇价的长期、中期以及短期趋势有一个全面的了解。
最长期时间框架确定价格的主要趋势——这将给我们展示汇价总体走势状况。
中期时间框架是我们最为常用的时间框架,它能够为我们提供中期买入或卖出的信号。
最短期时间框架显示的是价格短期趋势,它能够帮助我们找到真正的入场和出场点位。
你可以使用任何你自己觉得合适的时间框架,前提是你所选择的时间框架之间不能太远也不能太近。
下面,我们推荐给你几种常见的时间框架组合:
● 1分钟、5分钟和30分钟
● 5分钟、30分钟和4小时
● 15分钟、1小时和4小时
● 1小时、4小时和日图
● 4小时、日图和周图
当你在决定,不同时间框架之间应该相隔多少时间时,你首先应该确定,更小时间框架和更大时间框架之间价格的形态走势应该存在一定的区别,即更小时间框架对价格的走势描绘得更为详尽,而并不是这些在更小时间框架下能够展示出来的形态走势,在更大时间框架下也会显示出来。
如果所选取的时间框架过于接近,那么,你将难以发现不同时间框架下价格的不同走势情况,这也是没用的。
Summary Of Multiple Time Frame Analysis

So now you’re done! Now you can add multiple time frame analysis to your forex trading tool box!
Here are a few tips you should remember:
- You have to decide what the correct time frame is for YOU. This comes from trying different time frames out through different market environments, recording your results, and analyzing those results to find what works for you.
- Once you’ve found your preferred time frame, go up to the next higher time frame. Then make a strategic decision to go long or short based on the direction of the trend. Then return to your preferred time frame (or lower) to make tactical decisions about where to enter and exit (place stop and profit target).
- Adding the dimension of time to your analysis gives you an edge over the other tunnel vision forex traders who only trade off on only one time frame.
- Make it a habit to look at multiple time frames when trading.
- Make sure you practice! You don’t wanna get caught up in the heat of trading not knowing where the time frame button is! Make sure you know how to shift quickly between them. Heck, you should even practice having chart containing multiple time frames up at the same time!
- Choose a set of time frames that you are going to watch, and only concentrate on those time frames. Learn all you can about how the market works during those time frames.
- Don’t look at too many time frames, you’ll be overloaded with too much information and your brain will explode. And you’ll end up with a messy desk since there will be blood splattered everywhere. Stick to two or three time frames. Any more than that is overkill.
- We can’t repeat this enough: Get a bird’s eye view. Using multiple time frames resolves contradictions between indicators and time frames. Always begin your market analysis by stepping back from the markets and looking at the big picture.
Don’t believe us? Find out what other traders have to say about finding the best time frame to trade.
总结:多重时间框架分析

PS:在开始你的市场分析之前,不要离市场太近,而应该始终从更广的视角来观察市场。
现在,你已经做到了!你可以将多时间框架分析加进你的外汇工具箱!
以下是一些你应该记住的建议:
● 你必须确定适合你自身的正确时间框架。为了确定合适自身的时间框架,
你需要尝试在不同的市场环境下使用不同的时间框架,对你的交易结果进行记录,
分析这些结果并最终找出最适合你自身的交易时间框架。
● 一旦你已经找到你所偏好的时间框架,请打开更长时间框架的图形。然后,
基于价格在更长期时间框架下的形态走势确定是做多还是做空。随后,
再次转向你所偏好的时间框架(或更短期时间框架),以确定你的入场和退出策略(设置止损和获利目标)。
● 对更长时间框架图形的分析,你可以获得那些只关注单一时间维度的交易者所不曾好获得的更加广阔的交易视角。
● 当进行交易时,养成多重时间框架分析的习惯。
● 确保进行一定的交易练习。不要在进行交易的时候,还不知道切换不同时间窗口的按钮。
你应该知道如何在不同时间窗口之间快速的切换,你也应该学会在同一时间,将多重时间窗口在屏幕上同时显示。
● 选择你将要观察的一组时间框架,并集中于对这些时间框架的研究上,
进而从这些时间框架上了解到所有你能够获悉的市场信息。
● 不要关注过多的时间框架,过多的时间窗口信息会让你力不从心,你甚至有可能会因此崩溃。
选择两个或三个时间窗口足矣,多于这个数字并不太好。
● 对价格走势有一个全局性的把握还不够。你应该利用多重时间框架分析,
来解决不同指标和时间窗口所发出的相互矛盾信息问题。在开始你的市场分析之前,
不要离市场太近,而应该始终从更广的视角来观察市场。