Fibonacci Trading
We will be using Fibonacci ratios a lot in our trading so you better learn it and love it like your mother’s home cooking. Fibonacci is a huge subject and there are many different Fibonacci studies with weird-sounding names but we’re going to stick to two: retracement and extension.
Let us first start by introducing you to the Fib man himself…Leonardo Fibonacci.

No, Leonardo Fibonacci isn’t some famous chef. Actually, he was a famous Italian mathematician, also known as a super duper uber ultra geek.
He had an “Aha!” moment when he discovered a simple series of numbers that created ratios describing the natural proportions of things in the universe.
The ratios arise from the following number series: 0, 1, 1, 2, 3, 5, 8, 13, 21, 34, 55, 89, 144…
This series of numbers is derived by starting with 0 followed by 1 and then adding 0 + 1 to get 1, the third number. Then, adding the second and third number (1 + 1) to get 2, the fourth number, and so on.
After the first few numbers in the sequence, if you measure the ratio of any number to the succeeding higher number, you get .618. For example, 34 divided by 55 equals .618.
If you measure the ratio between alternate numbers you get .382. For example, 34 divided by 89 = 0.382 and that’s as far as into the explanation as we’ll go.
These ratios are called the “golden mean”. Okay that’s enough mumbo jumbo. With all those numbers, you could put an elephant to sleep. We’ll just cut to the chase; these are the ratios you HAVE to know:
Fibonacci Retracement Levels
0.236, 0.382, 0.500, 0.618, 0.764
Fibonacci Extension Levels
0, 0.382, 0.618, 1.000, 1.382, 1.618
You won’t really need to know how to calculate all of this. Your charting software will do all the work for you. Besides, we’ve got a nice Fibonacci calculator that can magically calculate those levels for you. However, it’s always good to be familiar with the basic theory behind the indicator so you’ll have the knowledge to impress your date.
Traders use the Fibonacci retracement levels as potential support and resistance areas. Since so many traders watch these same levels and place buy and sell orders on them to enter trades or place stops, the support and resistance levels tend to become a self-fulfilling prophecy.
Traders use the Fibonacci extension levels as profit taking levels. Again, since so many traders are watching these levels to place buy and sell orders to take profits, this tool tends to work more often than not due to self-fulfilling expectations.
Most charting software includes both Fibonacci retracement levels and extension level tools. In order to apply Fibonacci levels to your charts, you’ll need to identify Swing High and Swing Low points.
A Swing High is a candlestick with at least two lower highs on both the left and right of itself.
A Swing Low is a candlestick with at least two higher lows on both the left and right of itself.
You got all that? Don’t worry, we’ll explain retracements, extensions, and most importantly, how to grab some pips using the Fibonacci tool in the following lessons.
斐波纳契是什么?

我们在交易中经常使用斐波纳契比率,所以你需要更好地了解它,并且像喜欢你母亲的家常菜一样喜欢它。 斐波纳契是一个巨大的课题,对于它,有许多不同的怪异动听的名字和研究,但我们只讨论两个:回撤 和 扩展。
让我们首先给你介绍斐波纳契比率概念的发明人…Leonardo Fibonacci
不,莱昂纳多斐波纳契不是某位著名的厨师。 其实,他是意大利著名数学家,以欺骗、极端主义者和天才而闻名。
当他在描述宇宙万物的自然比例中发现一个简单的数字序列的时候,他就会发出“啊哈!”一声。
数字的顺序是这样出现:1,1,2,3,5,8,13,21,34,55,89,144 …
这些数字序列排列是由1开始衍生,其次是2,然后加入1 + 2得到第三个数字3。 然后,2 + 3得到第四个数字5,依此类推。
除了顺序中前几个的号码,如果你计算随后较高数字的比例关系,你都会得到0.618。 例如,34除以55等于0.618 。
如果计算相隔数字的比率你得到的是0.382。 例如,34除以89 等于 0.382,这个例子可以很好的解释这个原理。
这些比率就是所谓的“黄金分割”。 好吧,那绝不是胡言乱语。 所有这些数字足以让一头大象睡觉。 我们只需要直接切入正题,这些比率都是你需要弄懂的:
斐波纳契回撤比率
0.236,0.382,0.500,0.618,0.764
斐波纳契扩展比率
0,0.382,0.618,1.000,1.382,1.618
你不需要真正知道如何计算所有的数字。 您的制图软件会为你做所有的工作。 此外,我们已经有了一个很好的斐波纳契指标 ,可以神奇地帮你计算出那些斐波纳契比率位置。 无论如何,熟悉这些在指标背后的一些基本理论总是有好处的好的,所以你又有新的知识可以在约会时使用了。
交易者利用斐波纳契的回撤比率来寻找潜在的支撑和阻力区域。由于有许多交易者都观察者同样位置当做阻力和支撑位,并且在位置的附近挂买卖单,所以这些位置往往成为自我实现的支撑和阻力位。
交易者使用各级的斐波纳契的扩展比率作为获利兑现位置。 再次,由于许多交易者都观察者同样位置下单然后兑现利润,这工具的效应是来自交易者们的自我实现期望。
大部分图表软件都包括斐波纳契回撤线及扩展线的工具。为了将斐波纳契比率应用在你的图表中,你需要确定波段的高点和低点。
你都明白了? 不要担心,我们会继续解释回撤、扩展,最重要的是,在接下来的章节中我们会学习如何利用斐波纳契来抓些点。 How to Use Fibonacci Retracement to Enter a Forex Trade
The first thing you should know about the Fibonacci tool is that it works best when the forex market is trending.
The idea is to go long (or buy) on a retracement at a Fibonacci support level when the market is trending up, and to go short (or sell) on a retracement at a Fibonacci resistance level when the market is trending down.
Finding Fibonacci Retracement Levels
In order to find these Fibonacci retracement levels, you have to find the recent significant Swing Highs and Swings Lows. Then, for downtrends, click on the Swing High and drag the cursor to the most recent Swing Low.
For uptrends, do the opposite. Click on the Swing Low and drag the cursor to the most recent Swing High.
Got that? Now, let’s take a look at some examples on how to apply Fibonacci retracements levels to the currency markets.
Uptrend
This is a daily chart of AUD/USD.

Here we plotted the Fibonacci retracement levels by clicking on the Swing Low at .6955 on April 20 and dragging the cursor to the Swing High at .8264 on June 3. Tada! The software magically shows you the retracement levels.
As you can see from the chart, the Fibonacci retracement levels were .7955 (23.6%), .7764 (38.2%), .7609 (50.0%), .7454 (61.8%), and .7263 (76.4%).
Now, the expectation is that if AUD/USD retraces from the recent high, it will find support at one of those Fibonacci retracement levels because traders will be placing buy orders at these levels as price pulls back.
Now, let’s look at what happened after the Swing High occurred.

Price pulled back right through the 23.6% level and continued to shoot down over the next couple of weeks. It even tested the 38.2% level but was unable to close below it.
Later on, around July 14, the market resumed its upward move and eventually broke through the swing high. Clearly, buying at the 38.2% Fibonacci level would have been a profitable long term trade!
Downtrend
Now, let’s see how we would use the Fibonacci retracement tool during a downtrend. Below is a 4-hour chart of EUR/USD.

As you can see, we found our Swing High at 1.4195 on January 25 and our Swing Low at 1.3854 a few days later on February 1. The retracement levels are 1.3933 (23.6%), 1.3983 (38.2%), 1.4023 (50.0%), 1.4064 (61.8%) and 1.4114 (76.4%).
The expectation for a downtrend is that if price retraces from this low, it could possibly encounter resistance at one of the Fibonacci levels because traders who want to play the downtrend at better prices may be ready with sell orders there.
Let’s take a look at what happened next.

Yowza, isn’t that a thing of beauty?!
The market did try to rally, stalled below the 38.2% level for a bit before testing the 50.0% level. If you had some orders either at the 38.2% or 50.0% levels, you would’ve made some mad pips on that trade.
In these two examples, we see that price found some temporary forex support or resistance at Fibonacci retracement levels. Because of all the people who use the Fibonacci tool, those levels become self-fulfilling support and resistance levels.
One thing you should take note of is that price won’t always bounce from these levels. They should be looked at as areas of interest, or as Cyclopip likes to call them, “KILL ZONES!” We’ll teach you more about that later on.
For now, there’s something you should always remember about using the Fibonacci tool and it’s that they are not always simple to use! If they were that simple, traders would always place their orders at Fibonacci retracement levels and the markets would trend forever.
In the next lesson, we’ll show you what can happen when Fibonacci retracement levels fail.
斐波纳契回撤
首先你应该知道最,有效的的使用斐波纳契工具是在市场呈现趋势的时候。
而方法是:在上升趋势中,当价格回调到斐波纳契回撤位置时,做多单(买入);或是在下降趋势中,当价格回调到斐波纳契回撤位置时,做空单(卖出)。
为了找到这些回撤水平,你必须找到最近波段的显著高点和低点。然后用鼠标把斐波纳契工具移到高点和低点之间。明白了吗?
现在,让我们看看一些使用斐波纳契工具的例子。
上升趋势
这是澳元/美元的日线图。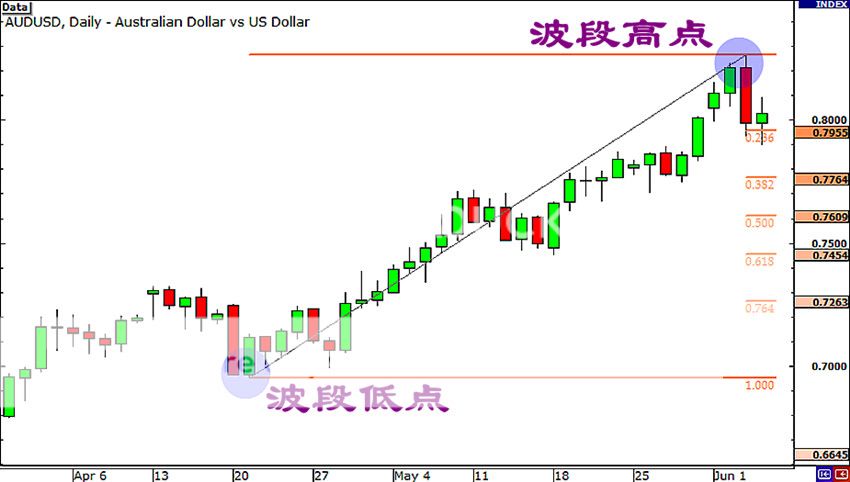
这里,我们在4月20号的波段低点0.6955位置,拖动斐波纳契指标到6月3号的波段高点0.8264位置。哇!该软件显示了神奇的回撤位置。
正如您从图中看到的,回撤的位置在0.7955(23.6%),0.7764(38.2%),0.7609(50.0%),0.7454(61.8%)和0.7263(76.4%)。
现在,观望如果澳元/美元从高处回调的话,它将会在斐波纳契的其中一个回撤位置找到支撑。因为很多交易者们将订单,放置在这些回撤的位置,所以它会得到这些斐波纳契位置的支撑。
现在,让我们来看看在波段出现高点后发生了什么事。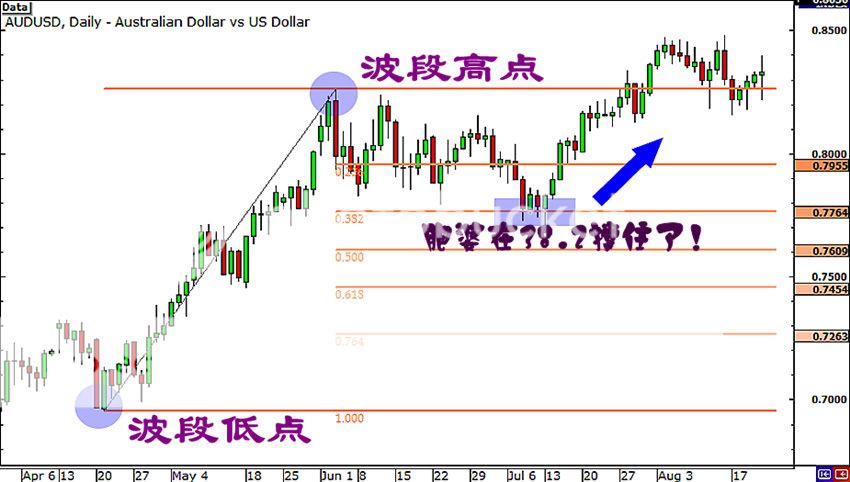
价格开始在23.6%的位置强力反弹,几天之后又继续滑落了几个星期。它测试了几次38.2%的位置,但都无法在收市时突破它。
后来,7月14日左右,市场恢复了上涨趋势并爆发的突破了波段的高点的。显然,在38.2%斐波纳契位置买入,长期而言将是一个有利可图的交易!
下跌趋势
现在,让我们看看如何在一个欧元/美元4小时图的下跌过程中使用斐波纳契回撤工具。 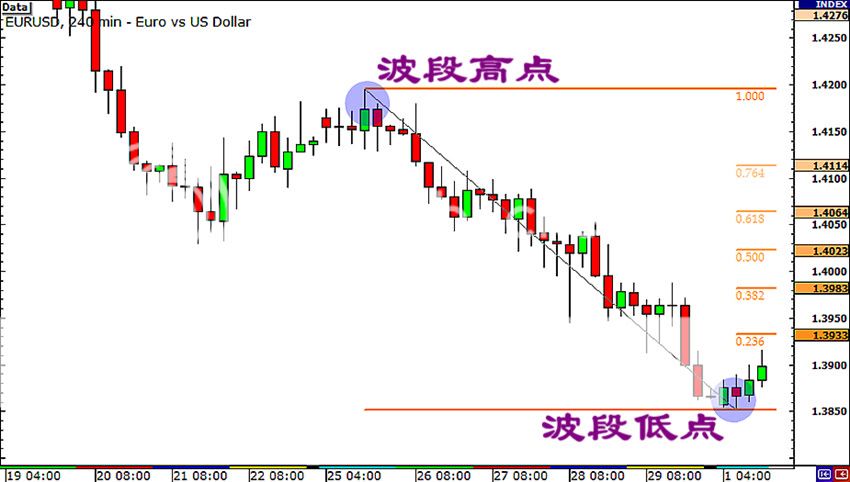
正如你所看到的,我们发现波段的高点在1月26号的1.4195位置,而低点在几天后2月2日的1.3854位置。斐波纳契回撤位置是1.3933(23.6%),1.3983(38.2%),1.4023(50.0%),1.4064(61.8%)和1.4114(76.4%)。
对于一个下跌趋势的看法是,如果价格从低点反弹,那么斐波纳契回撤的其中之一位置将成为关键的阻力位置,因为很多的交易者已经在这些位置附近挂上了卖单。
Fibonacci Retracement is NOT Foolproof
Back in Grade 1, we said that support and resistance levels eventually break. Well, seeing as how Fibonacci levels are used to find support and resistance levels, this also applies to Fibonacci!
Fibonacci retracements do NOT always work! They are not foolproof. Let’s go through an example when the Fibonacci retracement tool fails.
Below is a 4-hour chart of GBP/USD.
Here, you see that the pair has been in downtrend, so you decided to take out your Fibonacci retracement tool to help you spot a good entry point. You use the Swing High at 1.5383, with a swing low at 1.4799.
You see that the pair has been stalling at the 50.0% level for the past couple of candles.
You say to yourself, “Oh man, that 50.0% Fib level! It’s holding baby! Time to short this sucka!”
You short at market and start day dreaming that you’ll be driving down Rodeo Drive in your new Maserati with Scarlett Johansson (or if you’re a lady trader, Ryan Gosling) in the passenger seat…

Now, if you really did put an order at that level, not only would your dreams go up in smoke, but your account would take a serious hit if you didn’t manage your risk properly!
Take a look at what happened.

It turns out that that Swing Low was the bottom of the downtrend and market began to rally above the Swing High point.
What’s the lesson here?
While Fibonacci retracement levels give you a higher probability of success, like other technical tools, they don’t always work. You don’t know if price will reverse to the 38.2% level before resuming the trend.
Sometimes it may hit 50.0% or the 61.8% levels before turning around. Heck, sometimes price will just ignore Mr. Fibonacci and blow past all the levels just like how Lebron James bullies his way through the lane with sheer force.
Remember, the market will not always resume its uptrend after finding temporary support or resistance, but instead continue to go past the recent Swing High or Low.
Another common problem in using the Fibonacci retracement tool is determining which Swing Low and Swing High to use.
People look at charts differently, look at different time frames, and have their own fundamental biases. It is likely that Stephen from Pipbuktu and the girl from Pipanema have different ideas of where the Swing High and Swing Low points should be.
The bottom line is that there is no absolute right way to do it, especially when the trend on the chart isn’t so clear. Sometimes it becomes a guessing game.
That’s why you need to hone your skills and combine the Fibonacci retracement tool with other tools in your forex toolbox to help give you a higher probability of success.
In the next lesson, we’ll show you how to use the Fibonacci retracement tool in combination with other forms of support and resistance levels and candlesticks.
当斐波纳契应用失败时
还记得在 第 1 课 时,我们说过:不管多强劲的支撑和阻力位,最终都会被突破。所以,把斐波纳契的比率位置拿来当作支持和阻力位使用时,也会有同样的下场!
现在,让我们来看一个斐波纳契回撤指标失败的例子。
以下是 英镑/美元 4小时图。
在这里,您会看到一组在下降的货币对,然后你决定拿出你的斐波纳契指标来帮助你发现一个很好的下单点。你使用的价位是波段高点的1.5383位置和低点的1.4799位置。
你发现这组货币对50.0%的位置徘徊不前,你对自己说:“嘿,哥们,在肥婆的50.0%位置!价格被肥婆重重的压着不动,机会难得!”
你重重的下了卖单,然后开始梦想:自己驾着新的豪华开篷跑车在郊外,旁边载着位性感的美女(或者是英俊的帅哥) 。。。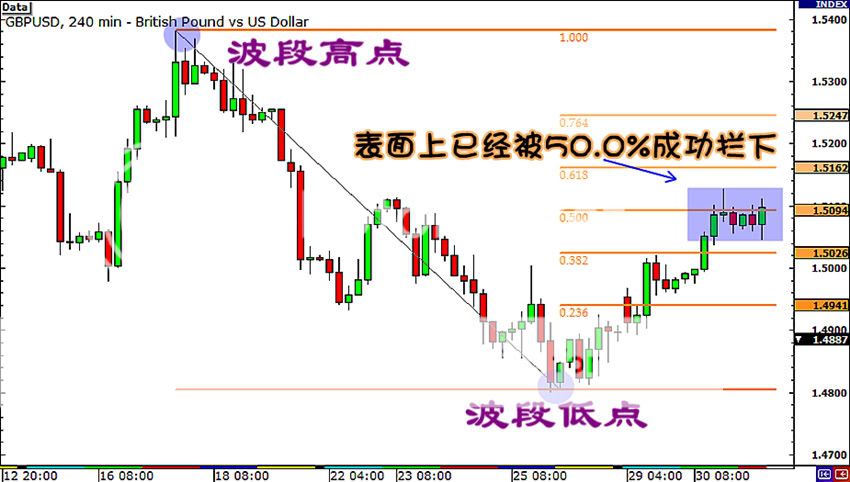
现在,如果你真的在这个位置下了一个订单,却没有做好正确的资金管理,那么不仅你的梦想会破灭,你的账户也会严重受到伤害!
看一下发生了什么事。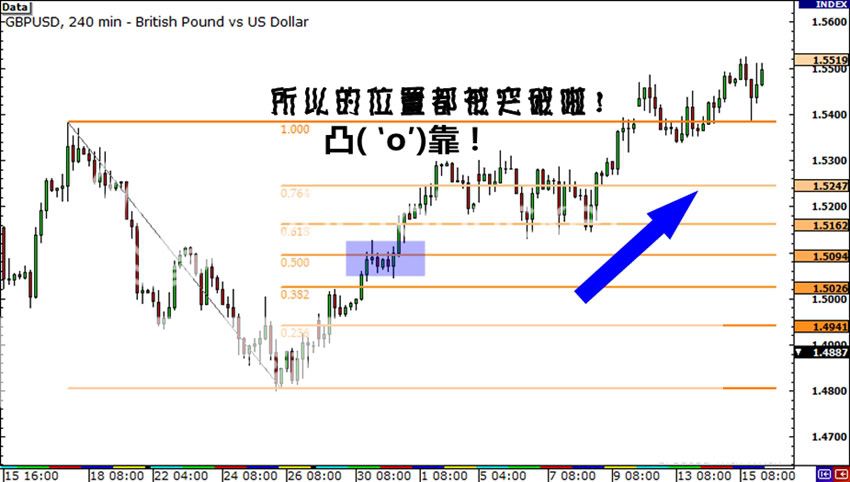
价格在波段的底点反弹,然后完全突破了波段的高点!这不止是个反弹,还是市场趋势的转向。
这让你学习到什么?
虽然斐波纳契的比率位置,可以给你一个更高的成功概率,但就像其他技术分析工具一样,它们并不是永远有效的。你不知道价格在回撤到 38.2%的位置后,是会扭转还是回复之前的趋势。
有时价格可能会达到50.0%或61.8%的位置才扭转。哎呀,有时价格根本不理会Fibonacci先生,就像甄子丹表演过五关斩六将的武术一样,所有的位置都被秒杀掉。
记住,市场趋势在遇见次级的支撑或阻力位后,可能会改变它原本的趋势,但也可能会保持趋势继续,直接突破所有的支撑或阻力位。
另一个使用斐波纳契指标最常见的问题就是:该怎么确定波段的高点和低点
大家用的图表不一样,看的时段也不同,并拥有自己的观点。就像来自火星的阿辉和水星的阿花一定会对哪里应该是波段的高点和低点有着不同的看法。
底线是,没有什么绝对正确的方法,尤其是在图表上趋势不那么明确的时候。有时,它会成为一个猜谜游戏。
这就是为什么你需要磨练自己的技术,并且将斐波那契指标与你外汇的其他指标相结合的原因,这才能增加你获得成功的胜算。
在下一课,我们将向您展示如何将斐波那契这指标,与其他类型的阻力和支撑位,或蜡烛线相结合。
How to Use Fibonacci Retracement with Support and Resistance
Like we said in the previous section, using Fibonacci levels can be very subjective. However, there are ways that you can help tilt the odds in your favor.
While the Fibonacci retracement tool is extremely useful, it shouldn’t be used all by its lonesome self.
It’s kinda like comparing it to NBA superstar Kobe Bryant. Kobe is one of the greatest basketball players of all time, but even he couldn’t win those titles by himself. He needed some backup.
Similarly, the Fibonacci retracement tool should be used in combination with other tools. In this section, let’s take what you’ve learned so far and try to combine them to help us spot some sweet trade setups.
Are y’all ready? Let’s get this pip show on the road!
Fibonacci Retracement + Support and Resistance
One of the best ways to use the Fibonacci retracement tool is to spot potential support and resistance levels and see if they line up with Fibonacci retracement levels.
If Fibonacci levels are already support and resistance levels, and you combine them with other price areas that a lot of other traders are watching, then the chances of price bouncing from those areas are much higher.
Let’s look at an example of how you can combine support and resistance levels with Fibonacci levels. Below is a daily chart of USD/CHF.

As you can see, it’s been on an uptrend recently. Look at all those green candles! You decide that you want to get in on this long USD/CHF bandwagon.
But the question is, “When do you enter?” You bust out the Fibonacci retracment tool, using the low at 1.0132 on January 11 for the Swing Low and the high at 1.0899 on February 19 for the Swing High.
Now your chart looks pretty sweet with all those Fibonacci retracement levels.

Now that we have a framework to increase our probability of finding solid entry, we can answer the question “Where should you enter?”
You look back a little bit and you see that the 1.0510 price was good resistance level in the past and it just happens to line up with the 50.0% Fibonacci retracement level. Now that it’s broken, it could turn into support and be a good place to buy.

If you did set an order somewhere around the 50.0% Fib level, you’d be a pretty happy camper!
There would have been some pretty tense moments, especially on the second test of the support level on April 1. Price tried to pierce through the support level, but failed to close below it. Eventually, the pair broke past the Swing High and resumed its uptrend.
You can do the same setup on a downtrend as well. The point is you should look for price levels that seem to have been areas of interest in the past. If you think about it, there’s a higher chance that price will bounce from these levels.
Why?
First, as we discussed in Grade 1, previous support or resistance levels would be good areas to buy or sell because other traders will also be eyeing these levels like a hawk.
Second, since we know that a lot of traders also use the Fibonacci retracement tool, they may be looking to jump in on these Fib levels themselves.
With traders looking at the same support and resistance levels, there’s a good chance that there are a ton of orders at those price levels.
While there’s no guarantee that price will bounce from those levels, at least you can be more confident about your trade. After all, there is strength in numbers!
Remember that trading is all about probabilities. If you stick to those higher probability trades, then there’s a better chance of coming out ahead in the long run.
结合斐波那契和支撑阻力位
就像我们上一课所说,使用斐波纳契比率位置是很主观的。不过,这里还有一些方法可以帮助你,提高对你有利的胜算。
虽然斐波纳契指标是非常有用的,但每次使用它时,不应该被单独的使用。
这有点像把它比作NBA巨星 Kobe Bryant。Kobe Bryant 是有史以来最伟大的篮球运动员之一,但如果只是他一人,是不能赢得所有称号的,他需要一些队友。
同样的,使用斐波纳契指标时,应该与其他的指标组合。在这一课,让我们看看你到目前为止学到的东西,并尝试将它们结合起来,好帮助我们发现一些不错的交易甜头。
你都准备好了吗?让我们在旅途上看看这些价格的表演!
最好的方法之一是使用斐波纳契指标,来发现潜在的支撑和阻力位置,看看他们是否和斐波纳契比率在同个位置上。
如果肥婆已经是在价格的支撑和阻力的位置了,这时你如果将其他类型交易者都在注意的价格位置相结合,哪价格从这些位置反弹的机会就会高得多了。
让我们看一个例子,你怎样将支撑和阻力位与斐波那契比率位结合的,以下是美元/瑞郎日线图。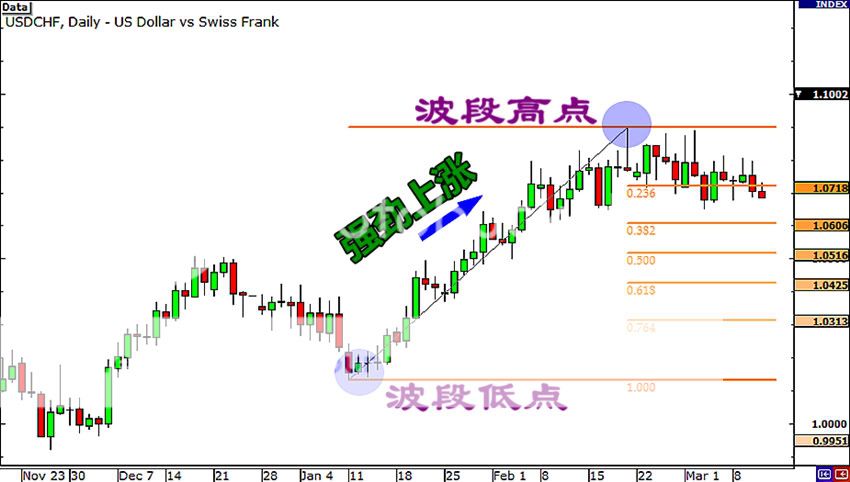
正如你看到的,最近的价格已经呈现上升的趋势。看看这些绿绿色的蜡烛!你决定,一定要加入这美元/瑞郎的多头队伍了。
但问题是,“你打算什么时候加入呢?” 你亮出斐波那契指标,在波段:1月11日的低点1.0132位置和在2月19日的高点1.0899位置,画出比率。
现在您的图表加上那些斐波那契的比率,看起来真不错。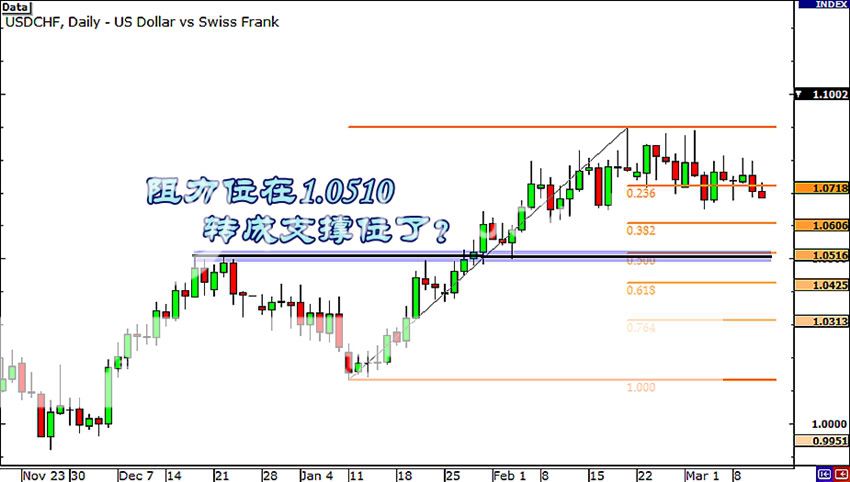
现在,我们用一个架构来增加我们的胜率,好找到一个漂亮的下单位置。我们可以回答这个问题:“你应该从哪里进来?”
你往回看一点点点,你会注意到价格1.0510的位置。之前,它曾是个很强劲的阻力位,后来被突破后成为了次级的支撑位。但它现在,刚好和50.0%的肥婆站在一起,是个买单的好位置。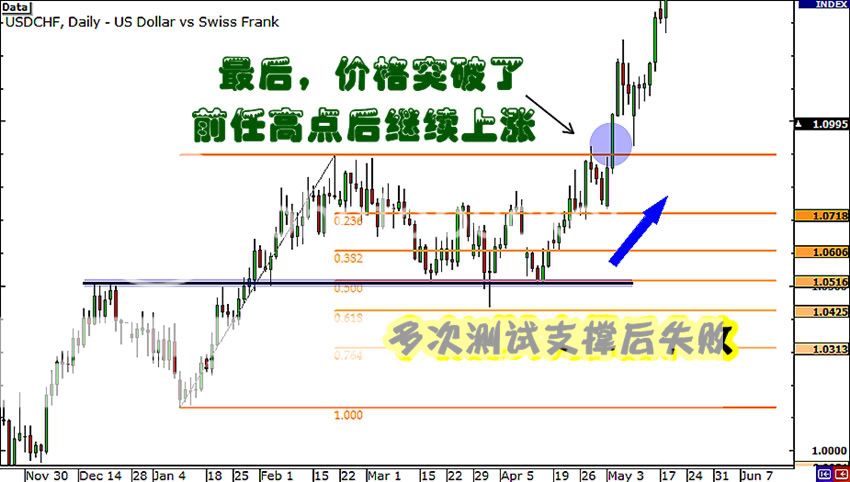
如果您确实在50.0%斐波那契比率的位置附近下了单,你将会成为一个非常开心快乐的人!
本来有一些非常紧张的时刻,特别是4月1日对支撑位置的第二次测试程度。价格试图强力的刺穿支持位,但是收盘时还是失败了。最后,那货币对打破了过去的波段高点,恢复上升的趋势。
您也可以把相同的步骤用在一个下跌的趋势中,关键是你应该寻找出那些在之前关心的价格位置。如果你在乎它们的话,价格会在这些位置有更高机率的反弹机会。
为什么呢?
首先,正如我们在 第 一 课 说过的,以前的支持和阻力水平将是个很好的买入或卖出的位置,因为其他交易者也将像老鹰一样紧盯着这些位置。
其次,因为我们知道有许多交易者也使用斐波纳契指标,在这些斐波那契比率的位置,他们会自己自动的跳进去。
因为很多的交易者看到了同样的支持和阻力位,所以在这些位置会有一座山的订单,绝对是下单的好机会。
虽然这样,依然不能保证价格会从这些位置反弹,但至少你可以对你的交易更有信心。毕竟,在概率上这是个高胜算的技术!
请记住,所有的交易技术都是建立在概率上的。如果你坚持那些概率较高的交易,一段时间之后就有机会成为市场赢家。
How to Use Fibonacci Retracement with Trend Lines
Another good tool to combine with the Fibonacci retracement tool is trend line analysis. After all, Fibonacci retracement levels work best when the market is trending, so this makes a lot of sense!
Remember that whenever a pair is in a downtrend or uptrend, traders use Fibonacci retracement levels as a way to get in on the trend. So why not look for levels where Fib levels line up right smack with the trend?
Here’s a 1-hour chart of AUD/JPY. As you can see, price has been respecting a short term rising trend line over the past couple of days.

You think to yourself, “Hmm, that’s a sweet uptrend right there. I wanna buy AUD/JPY, even if it’s just for a short term trade. I think I’ll buy once the pair hits the trend line again.”
Before you do that though, why don’t you reach for your forex toolbox and get that Fibonacci retracement tool out? Let’s see if we can get a more exact entry price.

Here we plotted the Fibonacci retracement levels by using the Swing low at 82.61 and the Swing High at 83.84.
Notice how the 50.0% and 61.8% Fib levels are intersected by the rising trend line.
Could these levels serve as potential support levels? There’s only one way to find out!

Guess what? The 61.8% Fibonacci retracement level held, as price bounced there before heading back up. If you had set some orders at that level, you would have had a perfect entry!
A couple of hours after touching the trend line, price zoomed up like Astro Boy on Red Bull, bursting through the Swing High.
Aren’t you glad you’ve got this in your forex toolbox now?
As you can see, it does pay to make use of the Fibonacci retracement tool, even if you’re planning to enter on a retest of the trend line. The combination of both a diagonal and a horizontal support or resistance level could mean that other traders are eying those levels as well.
Take note though, as with other drawing tools, drawing trend lines can also get pretty subjective.
You don’t know exactly how other traders are drawing them, but you can count on one thing – that there’s a trend!
If you see that a trend is developing, you should be looking for ways to go long to give you a better chance of a profitable trade. You can use the Fibonacci retracement tool to help you find potential entry points.
结合斐波那契和趋势线
趋势线是另外一个可以和斐波那契指标结合得很好的工具。毕竟,斐波纳契比率只有在市场有趋向时才会起作用,所以这是很有道理的!
记的,无论一组货币对是在下跌趋势还是上升趋势,交易者都会在趋势上画上斐波那契比率位置。那么,为什么不找找看斐波那契比率的哪一个位置,在趋势上深深的扎根了?
下面是澳元/日元 的1小时图。正如你所看到的,价格在过去几天里,一直保持在短期的上升趋势线上。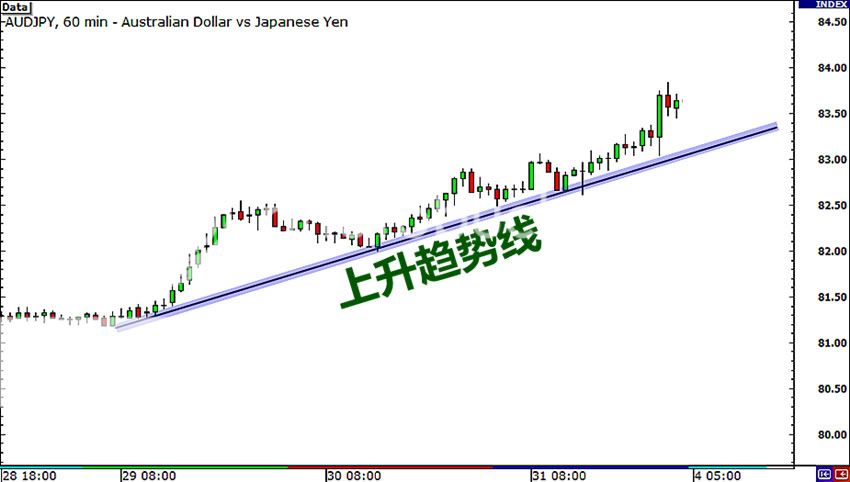
你的心里盘算着:“嗯,这是一个很好的上升趋势,炒个短线应该不错。等下一回价格碰到趋势线,我就买一些澳元/日元。”
在你做下单的动作之前,为什么不看看你的外汇工具盒,然后拿出斐波纳契指标呢?如果我们可以得到一个更精确的下单价格,何乐不为呢?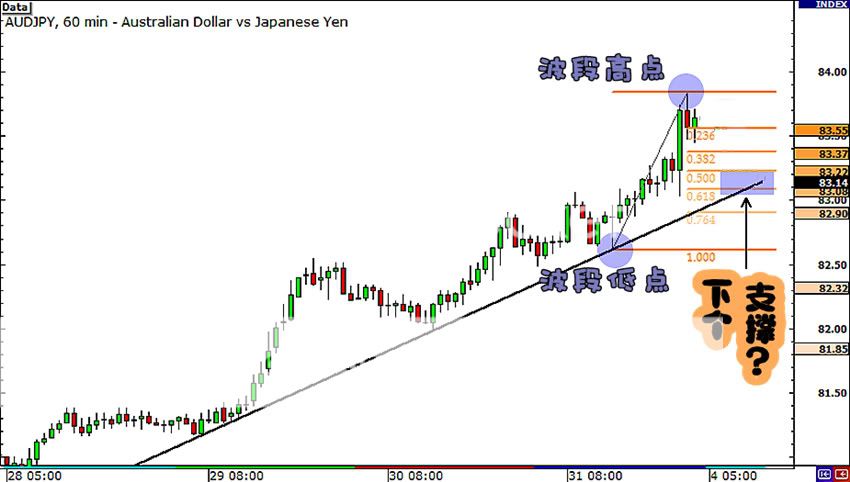
在这里,我们利用斐波纳契指标,在波段低点的82.61和高点的83.84,画出比率。
请注意,斐波那契50.0%和61.8%的位置,是如何跟上升的趋势线交叉在一起的。
这些位置是否可以作为潜在的支持位?这里只有一种办法可以找出答案! 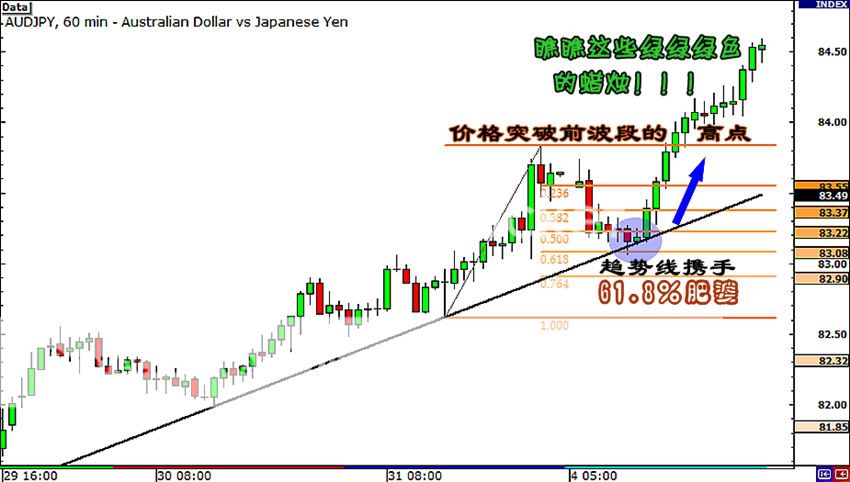
你猜怎么了?在斐波那契61.8%的位置,价格弹了起来,然后恢复趋势。如果你在那位置下了一些订单,你就有了一个完美的下单!
价格在接触到趋势线一段时间后,就像超人被红牛戳到屁股,迅速的攀升,然后突破了波段的高点。
你现在是不是很高兴,并将他们放进了你的外汇工具箱里?
正如你所看到的,即使你已经打算了在趋势线反弹时就下单,斐波那契指标还是有它使用价值的。结合了斜线和水平线的阻力或支撑位置,意味着可能有更多的交易者也把目光投向了那些位置。
不过,就像其他的指标工具一样,画趋势线也是有些主观的。你不知道其他交易者是怎样画的,但你可以坚信一点 – 就是那有一个趋势!
如果你看到一个趋势在发展,你应该想办法给自己一个更好的获利机会。您可以使用斐波纳契指标来帮助您找到潜在的下单点。
How to Use Fibonacci Retracement with Japanese Candlesticks
If you’ve been paying attention in class, you’d know by now that you can combine the Fibonacci retracement tool with support and resistance levels and trend lines to create a simple but super awesome trading strategy.
But we ain’t done yet! In this lesson, we’re going to teach you how to combine the Fibonacci retracement tool with your knowledge of Japanese candlestick patterns that you learned in Grade 2.
In combining the Fibonacci retracement tool with candlestick patterns, we are actually looking for exhaustive candlesticks. If you can tell when buying or selling pressure is exhausted, it can give you a clue of when price may continue trending.
We here at BabyPips.com like to call them “Fibonacci Candlesticks,” or “Fib Sticks” for short. Pretty catchy, eh? Let’s take a look at an example to make this clearer.
Below is a 1-hour chart of EUR/USD.

The pair seems to have been in a downtrend the past week, but the move seems to have paused for a bit. Will there be a chance to get in on this downtrend? You know what this means. It’s time to take the Fibonacci retracement tool and get to work!
As you can see from the chart, we’ve set our Swing High at 1.3364 on March 3, with the Swing Low at 1.2523 on March 6.
Since it’s a Friday, you decided to just chill out, take an early day off, and decide when you wanna enter once you see the charts after the weekend.

Whoa! By the time you popped open your charts, you see that EUR/USD has shot up quite a bit from its Friday closing price.
While the 50.0% Fib level held for a bit, buyers eventually took the pair higher. You decide to wait and see whether the 61.8% Fib level holds. After all, the last candle was pretty bullish! Who knows, price just might keep shooting up!

Well, will you look at that? A long legged doji has formed right smack on the 61.8% Fibonacci retracement level. If you paid attention in Grade 2, you’d know that this is an “exhaustive candle.” Has buying pressure died down? Is resistance at the Fibonacci retracement level holding? It’s possible. Other traders were probably eyeing that Fib level as well.
Is it time to short? You can never know for sure (which is why risk management is so important), but the probability of a reversal looks pretty darn good!

If you had shorted right after that doji had formed, you could have made some serious profits. Right after the doji, price stalled for a bit before heading straight down. Take a look at all those red candles!
It seems that buyers were indeed pretty tired, which allowed sellers to jump back in and take control. Eventually, price went all the way back down to the Swing Low. That was a move of about 500 pips! That could’ve been your trade of the year!
Looking for “Fib Sticks” can be really useful, as they can signal whether a Fibonacci retracement level will hold.
If it seems that price is stalling on a Fib level, chances are that other traders may have put some orders at those levels. This would act as more confirmation that there is indeed some resistance or support at that price.
Another nice thing about Fib Sticks is that you don’t need to place limit orders at the Fib levels. You may have some concerns whether the support or resistance will hold since we are looking at a “zone” and not necessarily specific levels.
This is where you can use your knowledge of candlestick formations.
You could wait for a Fib Stick to form right below or above a Fibonacci retracement level to give you more confirmation on whether you should put in an order.
If a Fib stick does form, you can just enter a trade at market price since you now have more confirmation that level could be holding.
结合斐波那契和蜡烛图
如果你一直有专心听讲,你现在知道,可以把斐波纳契指标和 支撑/阻力位或趋势线,结合一起来创建一个简单,但超级棒的交易策略。
但我们还没有完全结束!在这一课,我们将教你如何把你在 第二课 时学到的日本蜡烛图知识,与斐波纳契指标结合使用。
结合斐波纳契工具和蜡烛图的过程,我们实际上是在寻找蜡烛图的反转讯号。如果你可以看出买家或卖家的力量变化,它就可以给你一条价格反转时的线索。
在BabyPips这,我们喜欢叫它们“斐波纳契蜡烛图”或“肥婆的棒子”。相当的吸引人,是吧?为了使其更加清晰,让我们看一个例子。
以下是欧元/美元1小时图。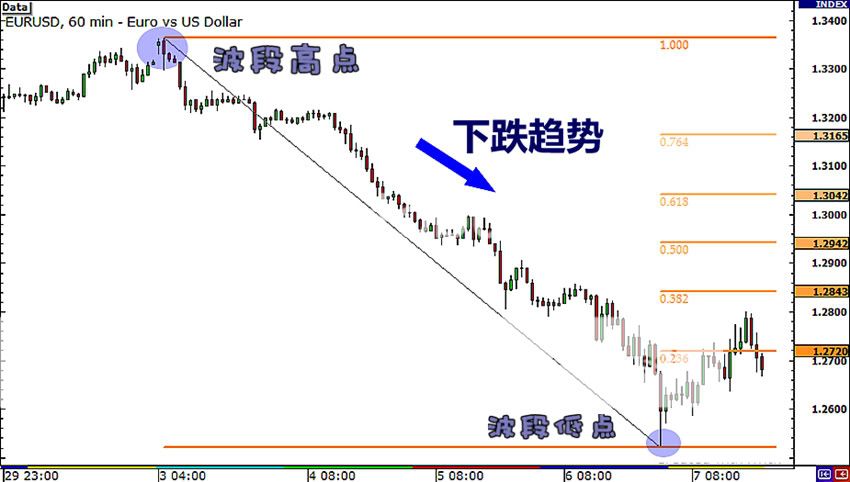
货币对似乎在过去一周一直呈下降趋势,但这个趋势看起来好像暂缓了一会儿。现在是不是一个在下降趋势中下单的机会?你知道这意味着什么。又是时候使用斐波纳契指标了!
正如你从图中可以看到,我们已经将波段的高点定在3月5日的1.3364,以及低点在3月7日的1.2523。
由于是星期五,所以你打算放松一下,早一天放假。然后决定周末过后看到图表后,才决定是否下单。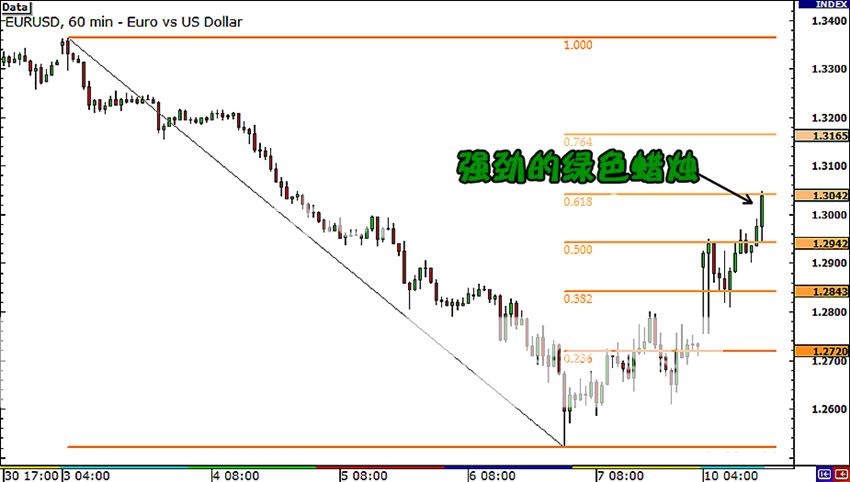
哇!周末过后你打开了图表,惊讶的发现欧元/美元在上周五收盘后,突然飞升了不少。
虽然50.0%的斐波那契阻挡了一段时间,但最终买家还是突破了。你决定等待,看看在61.8%的斐波那契位置是否能成功的阻挡下。毕竟,最后一支蜡烛的力道有些强劲!谁晓得呢,或许价格又会飞升上去!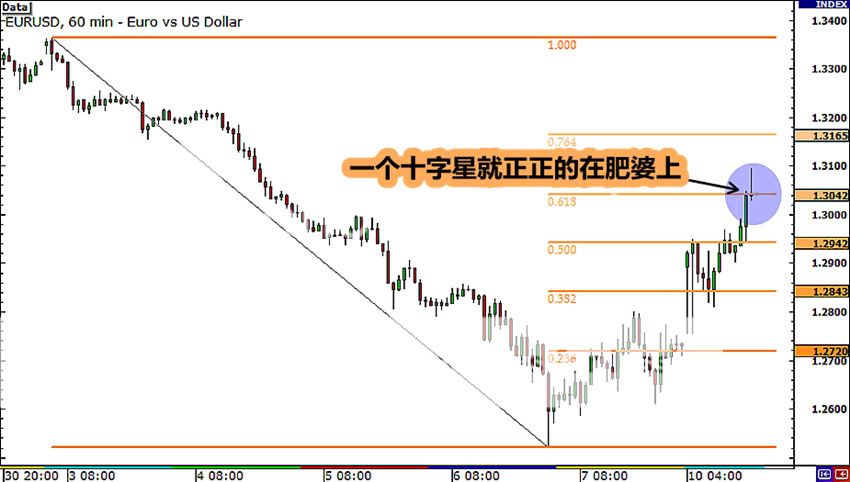
瞧,你看到了呢?长脚的十字星已经在61.8%斐波那契位置形成。如果你在第 2 课 时有留意,你就会知道,这是一个“反转讯号的蜡烛。”买家的力道转弱?是不是被斐波那契的位置,成功的阻挡下了?这是很可能的。因为其他交易者很可能也紧紧盯上了斐波那契的这个位置。
这是个下单的机会吗?你永远无法确定的知道(这就是为什么资金管理是非常重要的),但是逆转的可能性,看起来是非常的高!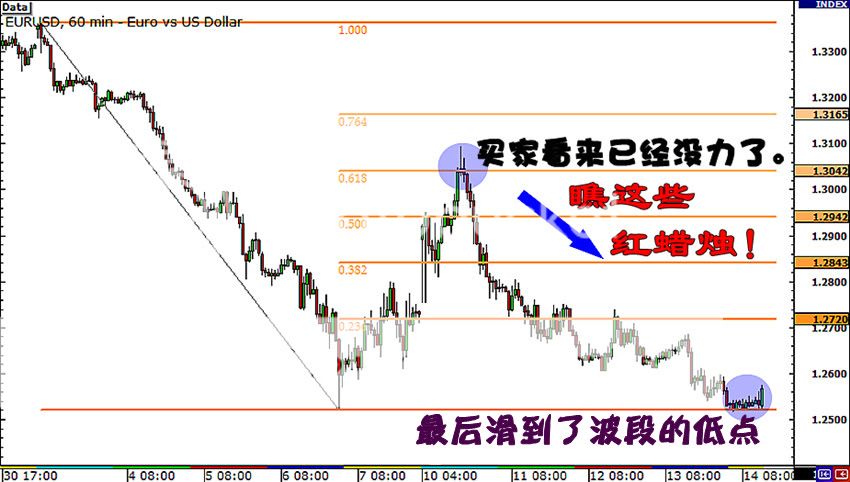
如果你在形成了十字星之后,已经立即下了单,那么你一定赚得蛮肥的了。十字星形成之后,价格停顿了一会儿,然后直线下跌。看看那些红红红色的蜡烛吧!
看来,买家确实有些疲惫无力了,这使得卖家重新得到了市场的控制权利。最终,价格一路回落到波段的低点。这是一个将近500点的移动!这些点数可能就足够你吃上一年了!
看来“肥婆的棒子”确实真的很有用,它们可以在斐波那契位置开始发挥效果时,给你打打暗号。
如果价格在斐波那契的位置,看起来有些停滞不前,很有可能是其他交易者把订单下在这些位置上。这举动可以更加的证实,价格在这位置确实遇到一些阻力或者支撑。
另一个肥婆棒子能给你的好处是,你不需要在斐波那契的位置上挂单后,忧心忡忡的担心位置被突破。现在我们可以盯着“一小段的区域”,而不是一条线的位置。
这是你可以表现您的蜡烛图知识的地方。
你需要等待一支肥婆棒子,在其中一个斐波那契的位置上下,收盘确认讯号后,才可以下单。
如果肥婆的棒子没有给出明确的讯号,但你却对那位置充满信心,哪么就像平时一样下单吧。
How to Use Fibonacci Extensions to Know When to Take Profit
The next use of Fibonacci will be using them to find targets.
Gotta always keep in mind “Zombieland Rules of Survival #22″ – When in doubt, know your way out! Let’s start with an example in an uptrend.
In an uptrend, the general idea is to take profits on a long trade at a Fibonacci Price Extension Level. You determine the Fibonacci extension levels by using three mouse clicks.
First, click on a significant Swing Low, then drag your cursor and click on the most recent Swing High. Finally, drag your cursor back down and click on any of the retracement levels.
This will display each of the Price Extension Levels showing both the ratio and corresponding price levels. Pretty neat, huh?
Let’s go back to that example with the USD/CHF chart we showed you in the previous lesson.

The 50.0% Fib level held strongly as support and, after three tests, the pair finally resumed its uptrend. In the chart above, you can even see price rise above the previous Swing High.
Let’s pop on the Fibonacci extension tool to see where would have been a good place to take off some profits.

Here’s a recap of what happened after the retracement Swing Low occurred:
- Price rallied all the way to the 61.8% level, which lined up closely with the previous Swing High.
- It fell back to the 38.2% level, where it found support
- Price then rallied and found resistance at the 100% level.
- A couple of days later, price rallied yet again before finding resistance at the 161.8% level.
As you can see from the example, the 61.8%, 100% and 161.8% levels all would have been good places to take off some profits.
Now, let’s take a look at an example of using Fibonacci extension levels in a downtrend.
In a downtrend, the general idea is to take profits on a short trade at a Fibonacci extension level since the market often finds support at these levels.
Let’s take another look at that downtrend on the 1-hour EUR/USD chart we showed you in the Fib Sticks lesson.
Here, we saw a doji form just under the 61.8% Fib level. Price then reversed as sellers jumped back in, and brought price all the way back down to the Swing Low.
Let’s put up that Fib Extension tool to see where would have been some good places to take profits had we shorted at the 61.8% retracement level.

Here’s what happened after price reversed from the Fibonacci retracement level:
- Price found support at the 38.2% level
- The 50.0% level held as initial support, then became an area of interest
- The 61.8% level also became an area of interest, before price shot down to test the previous Swing Low
- If you look ahead, you’ll find out that the 100% extension level also acted as support
We could have taken off profits at the 38.2%, 50.0%, or 61.8% levels. All these levels acted as support, possibly because other traders were keeping an eye out for these levels for profit taking as well.
The examples illustrate that price finds at least some temporary support or resistance at the Fibonacci extension levels – not always, but often enough to correctly adjust your position to take profits and manage your risk.
Of course, there are some problems to deal with here.
First, there is no way to know which exact Fibonacci extension level will provide resistance. Any of these levels may or may not act as support or resistance.
Another problem is determining which Swing Low to start from in creating the Fibonacci extension levels.
One way is from the last Swing Low as we did in the examples; another is from the lowest Swing Low of the past 30 bars. Again, the point is that there is no one right way to do it, but with a lot of practice, you’ll make better decisions of picking Swing points.
You will have to use your discretion in using the Fibonacci extension tool. You will have to judge how much longer the trend will continue. Later on, we will teach you methods to help you determine the strength of a trend.
For now, let’s move on to stop loss placement!
斐波纳契拓展
斐波那契的第二个用处是用来寻找利润兑现的目标。
首先你千千万万的要牢记着“僵尸乐园生存的#第22规则”——》感觉到危机的时候,清楚知道哪里是出口!让我们从一个上升趋势中的例子开始了解。
当处在上升的趋势时,最普遍的想法就是把买单获得的利润,通过斐波那契扩展位置,然后逐步兑现。你只要在滑鼠上按三下,就可以画出斐波那契的扩展位置了,指标会显示出价格扩展的比率和关键位置。很漂亮整洁的,是吧?
让我们继续使用前面课程中,美元/瑞郎的图表来当示范。
在50.0%肥婆位置的强烈支撑下,货币对经过三次的突刺失败后,终于恢复了上升趋势。在上图中,你甚至可以看见价格升破了波动的高点。
让我们亮出斐波那契扩展指标来看看,有哪些好位置可以让我们兑现一些利润。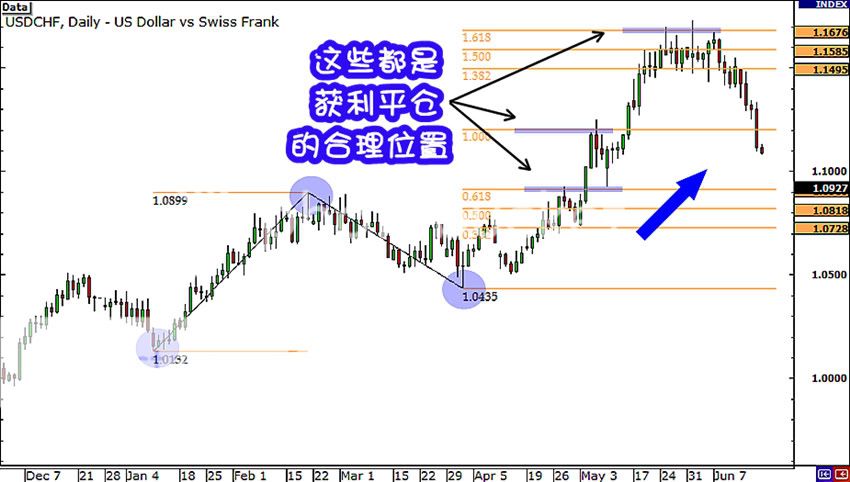
现在让我们来回顾一下,刚才价格在波段的低点反弹后,发生了什么事:
•价格一路攀升到61.8%的扩展位置停了下,这与之前的波段高点有着紧密的关系。
•它回落至38.2%的扩展位置,在这得到支撑。
•然后价格上升,到达了100%的扩展位置停了下。
•几天后,价格将再次上升到161.8%的扩展位置。
正如你所看到的这个例子,61.8%,100%和161.8%的扩展位置都是将利润逐步兑现的好地方。
现在,让我们从一个下跌趋势的例子中看看,如何使用斐波那契扩展的。
在一个下跌的趋势下,最普遍的想法是,把卖单获得的利润,通过斐波那契扩展位置,然后逐步兑现。因为市场经常在这些位置,获得支撑。
让我们来看看另一个例子, 欧元/美元 1小时的下跌趋势图,就是我们在肥婆棒子课程里展示给您的那个。
在这里,我们看到了价格在61.8%斐波那契位置处形成了一个十字形,然后就像所有卖方突然都下来卖单,价格反转,并一路回落到了波段低点。
让我们放上斐波那契扩展指标来看看,有哪些不错的位置好让我们平单获利。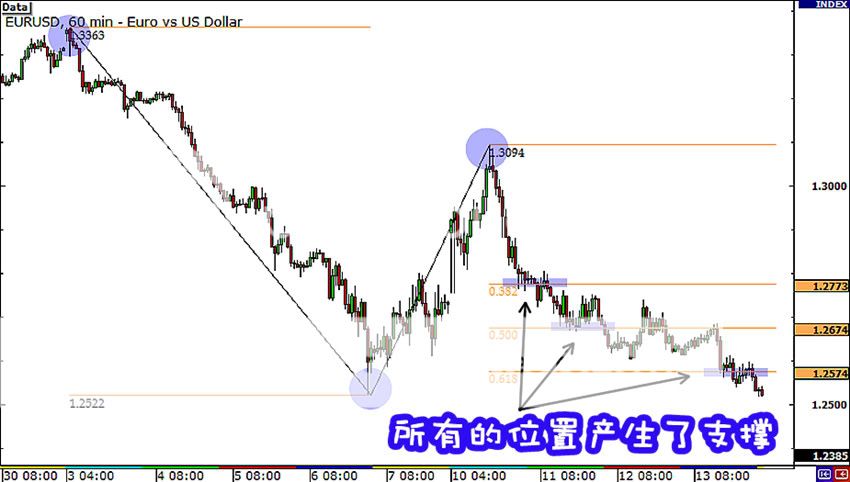
这是价格在斐波那契位置,反转后发生的事:
•价格滑落到38.2%的扩展位置,获得支撑
•在50.0%的扩展位置受到初步支撑的反弹,是个获利或加仓的区域
•在61.8%的扩展位置也是个获利或加仓的区域,然后价格继续下跌,开始尝试突破之前的波段低点。
•如果你继续往前看,你会发现,100%的扩展位置也是个受到支撑的位置。
我们可以在38.2%,50.0%,或者61.8%的位置兑现全部或部分的利润。所有这些位置会受到支撑,可能是因为其他交易者也紧盯着这些位置,准备平单获利。
这些例子说明,市场在经常斐波纳契的扩展位置,找到一些暂时的支撑或阻力位置- 虽然不会每一次都准确,但已经足够的机会让你平单、加仓和好好的调整过仓位了。
当然,这里也有一些问题要处理。
首先,就是没有办法知道哪一个确切的斐波纳契扩展位置会提供阻力。任何位置都有可能或是不可能成为支撑和阻力的位置。
另一个问题是在创建斐波那契扩展位置时,如何确立哪一个是波段的开始低点。
一种方法是我们曾经在课程例子中示范的;另一种是在过去的30只蜡烛中,选价格最低的低点。
再次强调,使用斐波那契扩展指标,没有绝对正确的方法,只有通过大量的练习统计,你才会在选择波段低点时做出更好的决策。
你需要灵活的使用斐波那契扩展来确定你的方向。您需要判断这一趋势将持续多久。稍后,我们将教给您,可以帮助您确定趋势强度的方法。
现在,让我们先说说止损位置!
How to Use Fibonacci to Place Your Stop so You Lose Less Money
Probably just as important as knowing where to enter or take off profits is knowing where to place your stop loss.
You can’t just enter a trade based on Fib levels without having a clue where to exit. Your account will just go up in flames and you will forever blame Fibonacci, cursing his name in Italian.
In this lesson, you’ll learn a couple of techniques to set your stops when you decide to use them trusty Fib levels. These are simple ways to set your stop and the rationale behind each method.
The first method is to set your stop just past the next Fibonacci level.
If you were planning to enter at the 38.2% Fib level, then you would place your stop beyond the 50.0% level. If you felt like the 50.0% level would hold, then you’d put your stop past the 61.8% level and so on and so forth. Simple, right?
Let’s take another look at that 4-hour EUR/USD chart we showed you back in the Fibonacci retracement lesson.

If you had shorted at the 50.0%, you could have placed your stop loss order just past the 61.8% Fib level.
The reasoning behind this method of setting stops is that you believed that the 50.0% level would hold as a resistance point. Therefore, if price were to rise beyond this point, your trade idea would be invalidated.
The problem with this method of setting stops is that it is entirely dependent on you having a perfect entry.
Setting a stop just past the next Fibonacci retracement level assumes that you are really confident that the support or resistance area will hold. And, as we pointed out earlier, using drawing tools isn’t an exact science.
The market might shoot up, hit your stop, and eventually go in your direction. This is usually when we’d go to a corner, and start hitting our head on the wall.
We’re just warning you that this might happen, sometimes a few times in a row, so make sure you limit your losses quickly and let your winners run with the trend. It might be best if you used this type of stop placement method for short term, intraday trades.
Now, if you want to be a little safer, another way to set your stops would be to place them past the recent Swing High or Swing Low.
This type of stop loss placement would give your trade more room to breathe and give you a better chance for the market to move in favor of your trade.

If the market price were to surpass the Swing High or Swing Low, it may indicate that a reversal of the trend is already in place. This means that your trade idea or setup is already invalidated and that you’re too late to jump in.
Setting larger stop losses would probably be best used for longer term, swing-type trades, and you can also incorporate this into a “scaling in” method, which you will learn later on in this course.
Of course, with a larger stop, you also have to remember to adjust your position size accordingly.
If you tend to trade the same position size, you may incur large losses, especially if you enter at one of the earlier Fib levels.
This can also lead to some unfavorable reward-to-risk ratios, as you may have a wide stop that isn’t proportional to your potential reward.
So which way is better?
The truth is, just like in combining the Fibonacci retracement tool with support and resistance, trend lines, and candlesticks to find a better entry, it would be best to use your knowledge of these tools to analyze the current environment to help you pick a good stop loss point.
As much as possible, you shouldn’t rely solely on Fibonacci levels as support and resistance points as the basis for stop loss placement.
Remember, stop loss placement isn’t a sure thing, but if you can tilt the odds in your favor by combining multiple tools, it could help give you a better exit point, more room for your trade to breathe, and possibly a better reward-to-risk ratio trade.
使用斐波那契来设置止损
就像在哪里能下单和获利平单一样,在哪里放置止损,同样的重要。
你不能在一个,没有出场讯号的基础上,单单使用斐波那契的位置来下单。你的账户很快会在趋势中燃烧起来。那么你会永远的责怪斐波那契,并用印度语来诅咒他。
在本课中,你会学到一些设置止损的技术,这些都是设置止损的简单方法。当你信赖斐波那契的位置时,就使用他们吧。
第一种方法是在价格刚经过斐波纳契的位置时,把止损放在下个斐波纳契的位置附近。
如果你打算在38.2%的斐波那契位置,下卖单的话,那么你应该把止损设置在50.0%的位置附近。那么,如果你觉得在50.0%的位置下卖单安全的话,那么你会把止损设置在61.8%的位置附近等等等等,以此类推。很简单,对吧?
让我们再看看一遍,在斐波那契回撤课中,4小时欧元/美元的图表。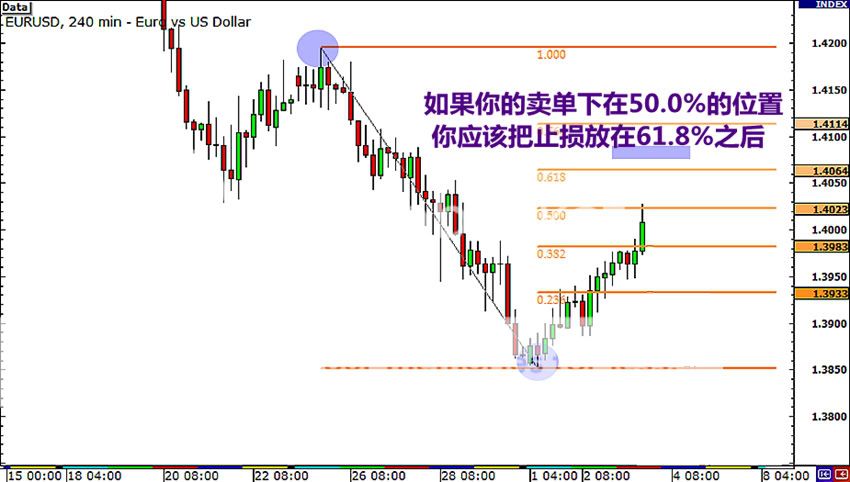
如果你把卖单下在50.0%,你应该会把你的止损定在61.8%的斐波那契位置附近。
这样设置止损的原因是,你相信50.0%的位置会成为一个很好的阻力位。但是假如,价格意想不到的突破那位置,那你的卖单就会自动平仓。
这种止损设置的方法,唯一问题就只是你需要有一个完美的入场点
假设你对在哪里找到支撑和阻力相当的有自信,那就可以用这方法,在斐波那契的下一个位置附近设置止损。而且,正如我们前面强调的,使用指标工具不是一门精确的科学。
而且市场很可能会迅速攀升,先打掉你的止损,再摇摇摆摆的朝你下单的方向走去。它就像当我们走到一个角落时,突然被人把我们的脑袋往墙上撞。
我们只是警告你,这可能发生,有时还会连续好几次,所以一定要迅速限制你的亏损单,并让你的盈利单继续与趋势同行。如果你是个短线和日内的交易者,这种类型的止损方法,对你或许是最好的。
现在,如果你想更保险一点,你可以使用另外一种方法,就是把止损设置在波段的高点或低点之后。
这种止损的方式,会给你的交易有更多的喘息空间,以及给你有更高的机率,市场会朝你喜欢的方向移动。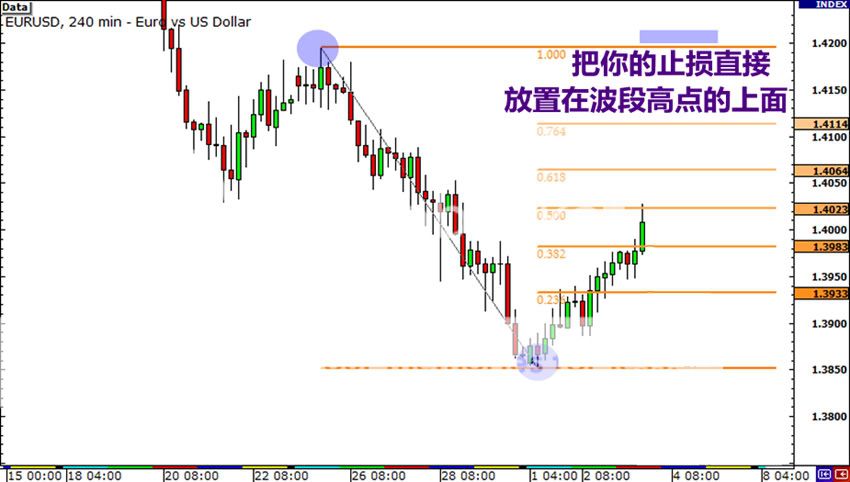
如果市场价格超越了波段的高点或低点,就可能表明了一个趋势的逆转已经形成了。也意味着你下单的念头或设置已经无效,或是你跳进去的手脚太慢了。
设置一个大的止损,对于长线交易者或波段交易者来说,是个不错的选择。您还可以把这方法组合进 “加仓策略”中。迟些时候,你将会学到这个策略。
当然,在一个大的止损下,你还是必须要记得,适当的调整你仓位的大小。
而且,如果你习惯于每次都下固定手数的单子,您可能会蒙受巨大的损失,特别是如果你在把单子,下在斐波那契水平初期的位置。
这方法对于 风险-回报-比 也有不利的影响,如果你的止损设置得太宽的话,会造成对你潜在的获利比率,不成正比。
所以,哪个方法比较好呢?
现实是,就像把斐波纳契指标 和 阻力\支撑、趋势线、蜡烛图结合在一起使用,来寻找一个更好的下单位置一样。只能根据当时的市场,结合你所有技术分析的经验,来帮你挑选最好的止损位置。
使用越多的分析经验就越好,而不应该单单的只用斐波纳契的位置,作为设置止损的基础。
请记住,止损位置的设置不是一个非做不可的事,但是如果你已经结合了自己所喜好的指标工具,并且得到不错的胜率。那止损就可以给你一个更好的出场点,更轻松的交易方式,和一个有更好的 风险-回报-比 的系统。
Summary of Fibonacci Trading

The key Fibonacci retracement levels to keep an eye on are: 23.6%, 38.2%, 50.0%, 61.8%, and 76.4%. And the levels that seem to hold the most weight are the 38.2%, 50.0%, and 61.8% levels, which are normally set as the default settings of most forex charting software. If your trading software doesn’t have a Fib tool, no worries – we’ve got a Fibonacci calculator that can generate the levels, requiring only a few pieces of data from you!
Remember that forex traders view the Fibonacci retracement levels as potential support and resistance areas. And because these levels tend to be closely watched by many, many forex traders, the support and resistance levels may become a self-fulfilling prophecy.
Similar to the retracement levels, the key Fibonacci extension levels are: 38.2%, 50.0%, 61.8%, as well as the 100%, 138.2% and 161.8% extensions.
Traders use the Fibonacci extension levels as potential support and resistance areas to set profit targets. Again, since so many forex traders are watching these levels and placing buy and sell orders to take profits, these levels can often become the end of the trend move due to self-fulfilling expectations.
In order to apply Fibonacci levels to your charts, you’ll need to identify Swing High and Swing Low points.
A Swing High is a candlestick with at least two lower highs on both the left and right of itself.
A Swing Low is a candlestick with at least two higher lows on both the left and right of itself.
When using Fibonacci tools, the probability of forex trading success could increase when used with other support and resistance levels, trend lines, and candlestick patterns for spotting entry and stop loss points.
总结:斐波那契

斐波纳契关键的回撤位,主要关注的是23.6%,38.2%,50.0%,61.8%和76.4%。而最常起到支撑作用的是38.2%,50.0%,61.8%的位置。它们通常是斐波纳契回撤软件的,默认设置。
交易者们利用斐波纳契回撤位作为潜在的支撑和阻力。由于有大量交易者,同时关注这些相同的位置,并在这些位置设置买/卖订单,或是在这些位置下单/止损。这使得这些支持和阻力位,成为一种交易者自我实现的现象。
主要斐波纳契扩展位是38.2%,50.0%,61.8%,100%,138.2%和161.8%。
交易者利用斐波那契扩展位,作为潜在的支撑和阻力,来设置获利的目标。同样,由于有许多交易者正关注着这些位置,并设置了买/卖订单来获得利润,这个工具因此发挥了自我实现的期望。
为了把斐波纳契水平位,套用到你的图表,你需要确定波段的高点和波段的低点。
一个波段的高点是,在高点的蜡烛左/右两边,都有根相对比它低的蜡烛。
一个波段的低点是,在低点的蜡烛左/右两边,都有根相对比它高的蜡烛。
由于许多交易者使用斐波纳契工具,这些位置往往成为,自我实现的支撑/阻力位,或是关注的位置。
在使用斐波纳契工具时,如果配合其他的支持/阻力位、趋势线,以及蜡烛的形态,来寻找下单和止损位置,肯定会大大增加成功的概率。