What is the US Dollar Index?
If you’ve traded stocks, you’re probably familiar with all the indices available such as the Dow Jones Industrial Average (DJIA), NASDAQ Composite Index, Russell 2000, S&P 500, Wilshire 5000, and the Nimbus 2001. Oh wait, that last one is actually Harry Potter’s broomstick.
Well if U.S. stocks have an index, the U.S. dollar can’t be outdone. For currency traders, we have the U.S. Dollar Index (USDX).
The U.S. Dollar Index consists of a geometric weighted average of a basket of foreign currencies against the dollar.
Say whutttt!?! Okay before you fall asleep after that super geeky definition, let’s break it down.
It’s very similar to how the stock indices work in that it provides a general indication of the value of a basket of securities. Of course, the “securities” we’re talking about here are other major world currencies.
The US Dollar Index Currency Basket
The U.S. Dollar Index consists of six foreign currencies. They are the:
- Euro (EUR)
- Yen (JPY)
- Pound (GBP)
- Canadian dollar (CAD)
- Krona (SEK)
- Franc (CHF)
Here’s a trick question. If the index is made up of 6 currencies, how many countries are included?
If you answered “6”, you’re wrong.
If you answered “23”, you’re a genius!
There are 23 countries total, because there are 18 members of the European Union that have adopted the euro as their sole currency, plus the other five countries (Japan, Great Britain, Canada, Sweden, and Switzerland) and their accompanying currencies.
It’s obvious that 23 countries make up a small portion of the world but many other currencies follow the U.S. Dollar index very closely. This makes the USDX a pretty good tool for measuring the U.S. dollar’s global strength.
US Dollar Index Components
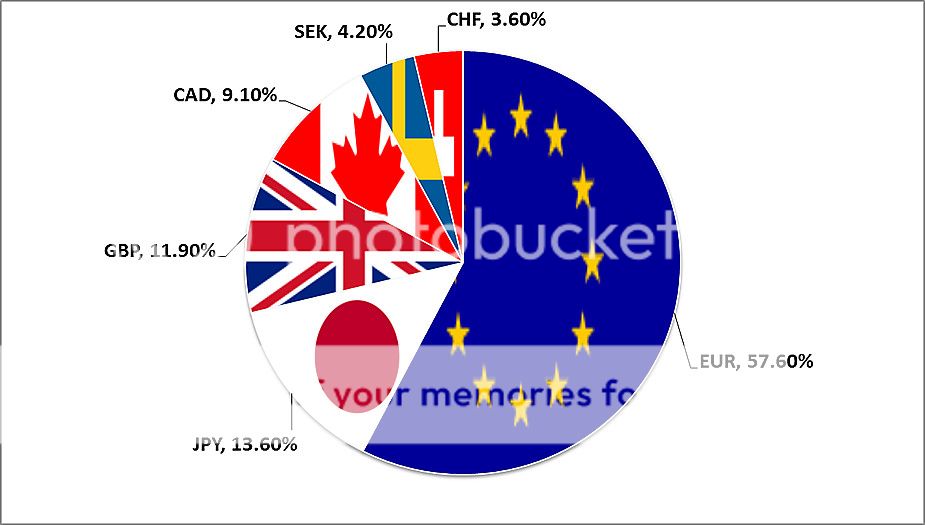
Now that we know what the basket of currencies is composed of, let’s get back to that “geometric weighted average” part. Because not every country is the same size, it’s only fair that each is given appropriate weights when calculating the U.S. dollar index. Check out the current weights:

With its 17 countries, euros make up a big chunk of the U.S. Dollar Index. The next highest is the Japanese yen, which would make sense since Japan has one of the biggest economies in the world. The other four make up less than 30 percent of the USDX.
Here’s something interesting: When the euro falls, which way does the U.S. Dollar Index move?
The euro makes up such a huge portion of the U.S. Dollar Index, we might as well call this index the “Anti-Euro Index”. Because the USDX is so heavily influenced by the euro, people have looked for a more “balanced” dollar index. More on that later though. First, let’s go to the charts!
什么是美元指数?
如果你曾进行过股票交易,你可能对这些指数,全部都很熟悉,比如道琼斯工业平均(DJIA)、纳斯达克综合指数、罗素2000小型股、标准普尔500、威尔希尔5000和光轮2001。哦。。。等等,最后一个其实是哈利波特的飞天扫帚。
既然美国股市有一个指数,那么美元也不能示弱,应该有个指数。对于外汇交易者们,我们确实有一个美元指数(USDX)。
美元指数是使用一篮子的其他货币,来对比美元的强弱情况。
说什什什么!?!好吧,在你听着这些,超级学术味的字眼,要睡着之前,让我们对它逐一的解析吧。
美元指数的运作,非常类似于股票指数,因为它为一篮子的股票价格,提供了一个市场平均的股票价格水平。当然,我们所说的“股票”,在这里就是指世界上的主要货币。
一个大篮子
美元指数是由种主要货币组成。它们是:
● 欧元(EUR)
● 日元(JPY)
● 英镑(GBP)
● 加元(CAD)
● 克郎(SEK)
● 瑞士法郎(CHF)
这里有一个含有圈套的问题。如果这指数是由6种货币组成,那么它包含了多少个国家?
如果你回答“6”,那你就错了。
如果你回答“21”,你真是个天才啊!
总共有21个国家,因为欧洲联盟由16名成员国组成,采用欧元作为他们的主要货币,然后再加上其他五个国家(日本,英国,加拿大,瑞典和瑞士),以及和欧盟随行的其他货币。
很明显的,21个国家只占了世界的很小的部分,但其它许多国家的货币都紧跟随着美元指数一起波动。这使得美元指数成为,用来衡量美元在全球汇率的影响力,一个相当不错的工具。
美元指数的成分
现在我们知道组成一篮子的主要货币有哪些了,让我们再回到“几何平均加权值”的这一部分上吧。因为不是每个国家的经济都是相同的规模,它唯一公平的方法是,在计算美元指数时,给每一个国家适当的权重。让我们看看目前的权重比例:
凭着其16个国家,欧元构成了美元指数的一大块。第二大块的是日元,这意味着日本是世界上最大的经济体之一。其他四块加起来,还不足美元指数的30%。
这里有一些有趣的事:当欧元下跌时,美元指数将往哪个方向移动呢?
欧元构成了美元指数的如此庞大一部分,所以我们不妨把美元指数也称为“反欧元指数”。由于美元指数是如此深受欧元的影响,所以人们纷纷寻找一个更加“平衡”的美元指数。接下来的课程,我们会进一步学习它。首先,让我们来看看图表!
How to Read the US Dollar Index
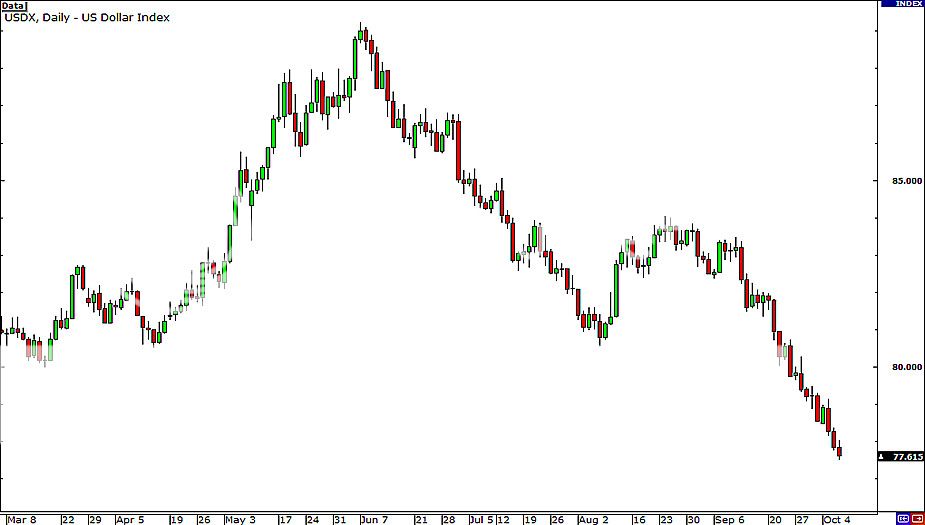
Just like any currency pair, the US Dollar Index (USDX) even has its own chart. Holler at the U.S. Dollar Index:
")
First, notice that the index is calculated 24 hours a day, five days a week. Also, the US Dollar Index (USDX) measures the dollar’s general value relative to a base of 100.000. Huh?!?
Okay. For example, the current reading says 86.212. This means that the dollar has fallen 13.79% since the start of the index. (86.212 – 100.000).
If the reading was 120.650, it means the dollar’s value has risen 20.65% since the start of the index. (120.650 – 100.00)
The start of the US Dollar Index is March 1973. This is when the world’s biggest nations met in Washington D.C. and all agreed to allow their currencies to float freely against each. The start of the index is also known as the “base period”.
The U.S. Dollar Index Formula
This is strictly for the grown and geeky. Here is the formula to calculating USDX:
USDX = 50.14348112 × EUR/USD^(-0.576) × USD/JPY^(0.136) × GBP/USD^(-0.119) × USD/CAD^(0.091) × USD/SEK^(0.042) × USD/CHF^(0.036)
Got that? Good! Now you can get a wedgie from the school bully.
We’re kidding!
Queen Cleopiptra usually includes the U.S. dollar index in her Chartology articles so if you’re planning to watch USDX, you should also find out what our resident chartologist has to say.
如何阅读美元指数
就像任何货币对一样,美元指数也有它自己的图表。让我们呼唤美元指数的图表出来吧:
首先,请注意该指数的是以,一天24小时,每周五天不断被最新计算的。此外,美元指数是使用100.000的基准,来衡量美元的普遍相对价值的。咦?!?
好吧。举个例子,如果当前的读数为86.212。这意味着,相对于指数的初始值,美元已经贬值了13.79%。(86.212 – 100.000)。
而如果读数是120.650,这意味着,相对于指数的初始值,美元升值了20.65%。(120.650 – 100.00)
美元指数是在1973年3月开始启用的。当时世界上的各大国,在美国的首都华盛顿哥伦比亚特区召开会议,并一致同意允许他们国家的货币汇率,可以自由的相对浮动。而美元指数就是由那时开始计算,这时也称为“基础期”。
美元指数的公式
这个指数,对于它的增长值,有令人讨厌的严格要求。下面是美元指数的计算公式:
美元指数= 50.14348112 × EUR/USD^(-0.576) × USD/JPY^(0.136) × GBP/USD^(-0.119)
× USD/CAD^(0.091) × USD/SEK^(0.042) × USD/CHF^(0.036)
明白了吗?很好!现在你可以向学校的恶霸们,拿回被他们扯掉的内裤了。
我们是开玩笑的啦!
Trade-Weighted Dollar Index
There is also another kind of dollar index used by the Federal Reserve. It is called the “trade-weighted U.S. dollar index“.
The Fed wanted to create an index that could more accurately reflect the dollar’s value against foreign currencies based on how competitive U.S. goods are compared to goods from other countries. It was formed in 1998 in order to keep up-to-date with U.S. trade.
The Trade-Weighted U.S. Dollar Index
Here is the current weighting (in percentage) of the index:
| Country | Weight(%) |
|---|---|
| Euro zone | 16.22 |
| China | 20.81 |
| Canada | 12.618 |
| Mexico | 11.67 |
| Japan | 7.552 |
| United Kingdom | 3.393 |
| Korea | 3.8 |
| Taiwan | 2.381 |
| Singapore | 1.889 |
| Brazil | 2.204 |
| Malaysia | 1.467 |
| Hong Kong | 1.269 |
| India | 1.958 |
| Switzerland | 1.634 |
| Thailand | 1.408 |
| Australia | 1.415 |
| Russia | 1.202 |
| Israel | 1.034 |
| Sweden | 0.734 |
| Indonesia | 1.063 |
| Saudi Arabia | 1.071 |
| Chile | 0.876 |
| Philippines | 0.553 |
| Colombia | 0.664 |
| Argentina | 0.63 |
| Venezuela | 0.485 |
| Total | 100 |
*Weights as of October 21, 2013
The main difference between the USDX and the trade-weighted U.S. dollar index is the basket of currencies used and their relative weights.
The trade weighted index includes countries from all over the world, including some developing countries. Given how global trade is developing, this index is probably a better reflection of the dollar’s value across the globe.
The weights are based on annual trade data.
Weights for the broad index can be found at http://www.federalreserve.gov/releases/H10/Weights.
If you’d like to see historical data, check out http://www.federalreserve.gov/releases/h10/Summary/.
贸易加权美元指数
还有另一种类型的美元指数,是由美国联邦储备委员会公布的。它被称为“贸易加权美元指数”。
美联储希望建立一种美元指数,它可以更准确地反映美国商品,在国际的竞争力。它成立于1998年,依据每年美国和其它国家的贸易额来修订各国的加权比重。
货币种类和权重
这是目前各国的货币,在该指数所占的权重(百分比):
| 国家或地区 | 2012 | 2011 | 2010 | 2009 | 2008 |
| 欧元区* | 16.36 | 16.36 | 16.334 | 17.605 | 17.826 |
| 加拿大* | 13.233 | 13.233 | 13.238 | 13.249 | 14.614 |
| 日本* | 7.796 | 7.796 | 7.799 | 7.482 | 8.311 |
| 墨西哥 | 11.452 | 11.452 | 11.456 | 10.364 | 9.579 |
| 中国 | 19.756 | 19.756 | 19.764 | 19.867 | 17.96 |
| 英国* | 3.541 | 3.541 | 3.542 | 4.227 | 4.164 |
| 台湾 | 2.601 | 2.601 | 2.602 | 2.41 | 2.488 |
| 韩国 | 3.858 | 3.858 | 3.86 | 3.688 | 3.552 |
| 新加坡 | 2.037 | 2.037 | 2.038 | 2.09 | 1.919 |
| 香港 | 1.307 | 1.307 | 1.307 | 1.33 | 1.308 |
| 马来西亚 | 1.836 | 1.836 | 1.837 | 1.739 | 1.793 |
| 巴西 | 2.068 | 2.068 | 2.068 | 1.899 | 2.093 |
| 瑞士* | 1.684 | 1.684 | 1.685 | 1.794 | 1.534 |
| 泰国 | 1.45 | 1.45 | 1.451 | 1.423 | 1.381 |
| 菲律宾 | 0.6 | 0.6 | 0.6 | 0.567 | 0.596 |
| 澳大利亚* | 1.314 | 1.314 | 1.314 | 1.336 | 1.289 |
| 印尼 | 1.111 | 1.111 | 1.111 | 1.032 | 0.987 |
| 印度 | 1.775 | 1.775 | 1.775 | 1.699 | 1.574 |
| 以色列 | 1.086 | 1.086 | 1.086 | 1.137 | 1.163 |
| 沙特阿拉伯 | 0.806 | 0.806 | 0.807 | 0.808 | 1 |
| 俄国 | 1.116 | 1.116 | 1.115 | 1.02 | 1.452 |
| 瑞典* | 0.84 | 0.84 | 0.837 | 0.87 | 0.961 |
| 阿根廷 | 0.569 | 0.569 | 0.57 | 0.549 | 0.568 |
| 委内瑞拉 | 0.4 | 0.4 | 0.4 | 0.409 | 0.47 |
| 智利 | 0.784 | 0.784 | 0.784 | 0.783 | 0.831 |
| 哥伦比亚 | 0.619 | 0.619 | 0.619 | 0.622 | 0.586 |
| 总数 | 100 | 100 | 100 | 100 | 100 |
美元指数与贸易加权美元指数之间的主要区别,在于篮子中所用的货币和它们的权重不同。
贸易加权指数加入了来自世界各地的其他国家,包括一些发展中国家。鉴于全球贸易的发展,该指数可以更好的反映出,美元在全球范围内的价值。
该指数的权重是以每年的贸易数据为依据的。
各国货币的权重可以在这里找到:http://www.federalreserve.gov/releases/H10/Weights
如果您想看之前的资料,在这里:http://www.federalreserve.gov/releases/h10/Summary/
How to Use the USDX for Forex Trading
I bet you’re wondering, “How do I use this USDX in my trading arsenal?”
Well, hold your trigger finger and you’ll soon find out! We all know that most of the widely traded currency pairs include the U.S. dollar. If you don’t know, some that include the U.S. dollar are EUR/USD, GBP/USD, USD/CHF, USD/JPY, and USD/CAD.
What does this mean? If you trade any of these pairs, the USDX can be the next best thing to sliced bread (or hamburger on a bun… or chocolate ice cream).
If you don’t, the USDX will still give you an idea of the relative strength of the U.S. dollar around the world. In fact, when the market outlook for the U.S. dollar is unclear, more often times than not, the USDX provides a better picture.
In the wide world of forex, the USDX can be used as an indicator of the U.S. dollar’s strength.
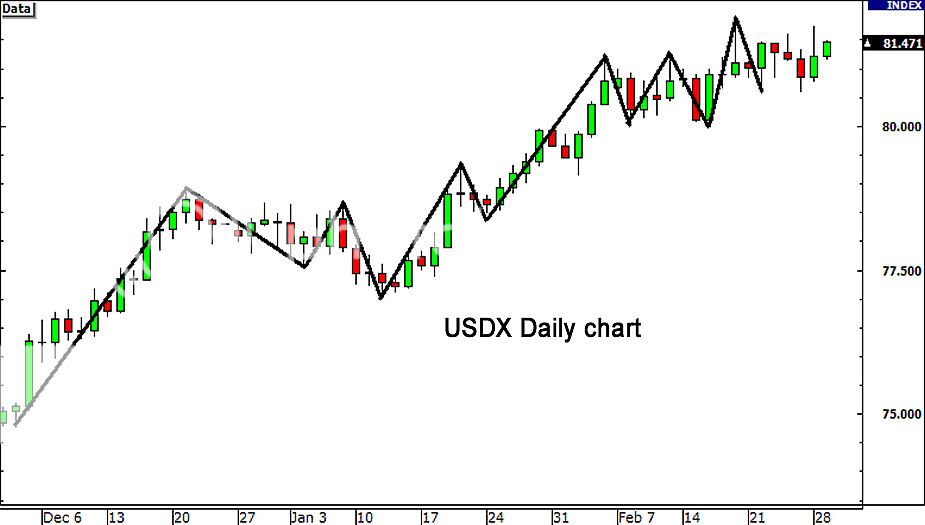
Because the USDX is comprised of more than 50% by the euro zone, EUR/USD is quite inversely related. Check it:

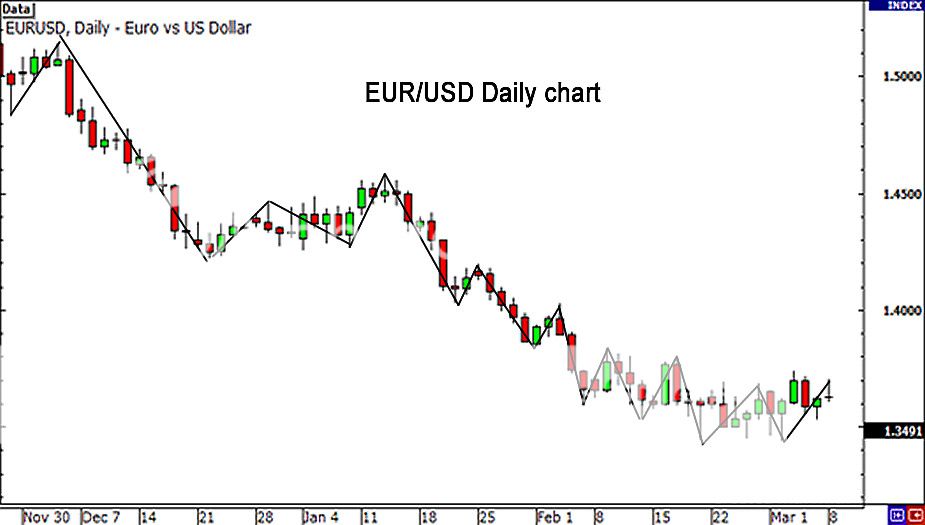
Next, take a look at a chart of EUR/USD.

It’s like a mirror image! If one goes up, the other most likely goes down. Will you look at that? It seems like the trend lines almost inversely match up perfectly. This could be a big help to those big on trading EUR/USD.
Some of our forex trading friends in the forums monitor the USDX as an indicator for EUR/USD. Hang out with them if you wanna learn more about using this index.
If the USDX makes significant movements, you can almost surely expect currency traders to react to the movement accordingly. Both the USDX and forex traders react to each other. Breakouts in spot USD pairs will almost certainly move the USDX in similar breakout fashion.
To sum it all up, forex traders use the USDX as a key indicator for the direction of the USD.
Always keep in mind the position of the USD in the pair you are trading.
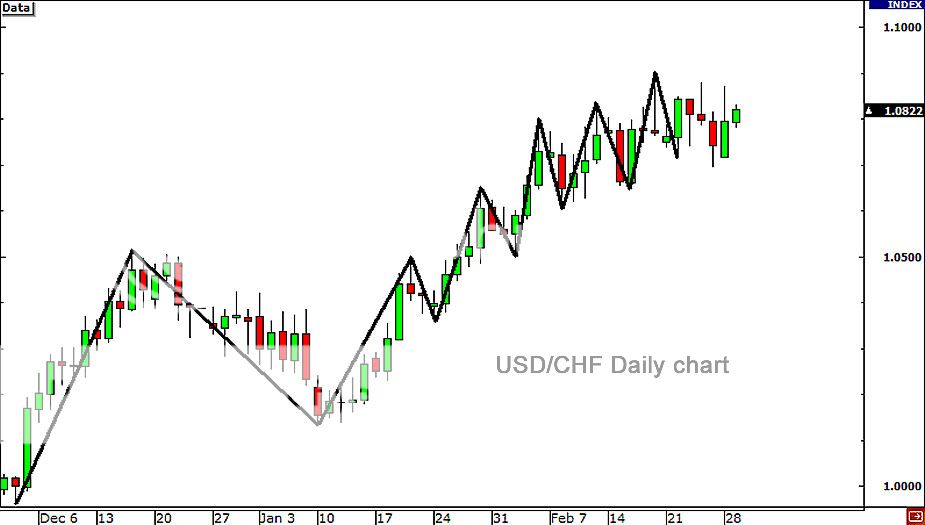
For example, if the USDX is strengthening and rising, and you are trading EUR/USD, a strong USD will show a downtrend on the EUR/USD chart. If you are trading a pair in which the USD is the based currency, such as the USD/CHF, a rise in the USDX will most likely show a rise in USD/CHF charts like the one shown below.


Here are two little tips you should always remember:
If USD is the base currency (USD/XXX), then the USDX and the currency pair should move the same direction.
If USD is the quote currency (XXX/USD), then the USDX and the currency pair should move in opposite directions.
使用美元指数在外汇上
我敢肯定你们一定都很想知道,“我该如何使用这件,在我的交易军火库内的新武器?没有问题,先松开你那扣扳机的手指,你很快就能学会了!我们都知道,交易最广泛的货币对都包含了美元。如果你不知道的话,那么一些包含美元的货币对,有:欧元/美元、英镑/美元、美元/瑞士法郎、美元/日元,和美元/加元。
这意味着什么?如果你有交易任何的这些货币对,美元指数可以成为你,塞在切片面包里的最好食材(或是把它塞在汉堡包的面包上… 还是用来夹巧克力冰淇淋也行)。
如果你不这样做,美元指数仍然可以给你提供一个概念,关于美元和世界各种货币之间的相对强弱。实际上,当市场对美元的前景不明确时,往往更多的时候,美元指数为我们提供了一个更好的描述。
在所有的外汇世界中,美元指数可以被用来,作为美元强度的指标。由于美元指数有50%以上是由欧元区组成,所以欧元/美元的汇率和它明显是相反的。看看下面的图表:
接下来看下欧元/美元的图表。
它们就像一面镜子!如果一个上升,那另一个多数就会下跌。你有注意到吗?它们的趋势线看起来,似乎是完全呈反比的完美匹配。这对于那些偏爱交易欧元/美元的,将是一个很大的帮助。
如果美元指数出现了明显的变动,你几乎可以肯定,不久后货币现货市场的交易者们,很快就会对这变动做出相应的反应。无论是美元指数的交易者们,还是外汇现货的交易者们,彼此之间是相互反应的。所以如果美元的现货市场,出现了突破的行情。几乎可以肯定,在美元指数的市场,也会上演着相似的突破移动。
总的来说,外汇的交易者们,把美元指数当做确认美元方向的,一个重要指标。
但是,使用美元指数时,千万要牢记着美元,是在你交易的货币对哪一方。
举例来说,当你交易欧元/美元的时候,如果美元指数正日益走强,并不断的上升着,强劲的美元会导致欧元/美元的图表上,出现一个下跌的趋势。而如果你正交易的货币对,美元是作为基础货币时,就像是美元/瑞郎。那么美元指数的上升,将非常可能导致美元/瑞郎的图表呈上升的趋势,就像下图所示的那样。
这里有两个小技巧,你应该要永远记住:
如果美元是基础货币时(美元/ XXX),则美元指数和货币对的移动应该是往同一个方向。
如果美元是报价货币时(XXX/美元),则美元指数和货币对的移动应该是朝着相反的方向。
The Dollar Smile Theory
Ever wonder why the dollar strengthens both in times of tough luck and when the economy is booming like a Beyoncé single? Well, so does everybody else. In fact, this really smart dude over at Morgan Stanley came up with a theory to explain this phenomenon.
Stephen Jen, a former currency strategist and economist, came up with a theory and named it the “Dollar Smile Theory.” His theory depicts three main scenarios directing the behavior of the U.S. dollar. Here’s a simple illustration:

 Scenario 1: The first part of the smile shows the U.S. dollar benefiting from risk aversion, which causes investors to flee to “safe-haven” currencies like the dollar and the yen. Since investors think that the global economic situation is shaky, they are hesitant to pursue risky assets and would rather buy up the less risky U.S. dollar regardless of the condition of the U.S. economy.
 Scenario 2: Dollar drops to new low. The bottom part of the smile reflects the lackluster performance of the Greenback as the U.S. economy grapples with weak fundamentals.
The possibility of interest rate cuts also weighs the U.S. dollar down.
This leads to the market shying away from the dollar. The motto for USD becomes “Sell! Sell! Sell!”
 Scenario 3: Dollar appreciates due to economic growth. Lastly, a smile begins to form as the U.S. economy sees the light at the end of the tunnel. As optimism picks up and signs of economic recovery appear, sentiment towards the dollar begins to pick up. In other words, the greenback begins to appreciate as the U.S. economy enjoys stronger GDP growth and expectations of interest rate hikes increase.
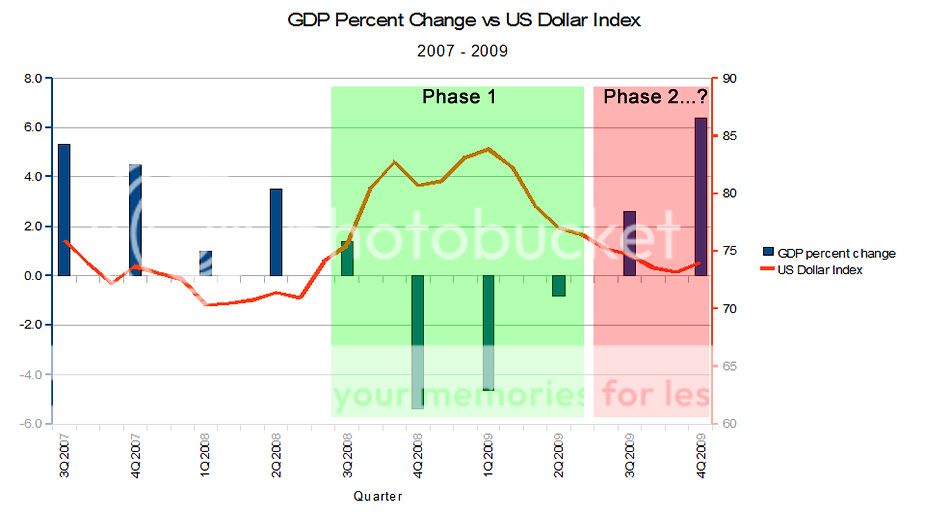
This theory appears to have been in play when the 2007 financial crisis began. Remember when the dollar got a huge boost at the peak of the global recession? That’s phase 1.
When the market eventually bottomed out in March 2009, investors suddenly switched back to the higher yielding currencies, making the dollar the winner of the “Worst Currency” award for 2009.

So will the Dollar Smile Theory hold true?
Only time will tell.
In any case, this is an important theory to keep in mind. Remember, all economies are cyclical.
The key part is determining which part of the cycle the economy is in.
美元微笑理论
有没有人觉得奇怪过,为什么当世界的经济低迷时,或是当美国的经济繁荣时候,美元就会像嘻哈天王Jay-Z的混音说唱专辑一样的火红?所以,是每个人都在奇怪这个问题咯。事实上,在Morgan Stanley投资公司的,一位超级绝顶聪明的花花公子,想出了一个理论来解释这一现象。
Morgan Stanley投资公司的,前任货币战略策划师和经济学家Stephen Jen。想出了一个理论,并命名为“美元微笑理论”。他的理论描述了三种引导美元走势,的主要情况。这里使用一个简单的例子来说明:
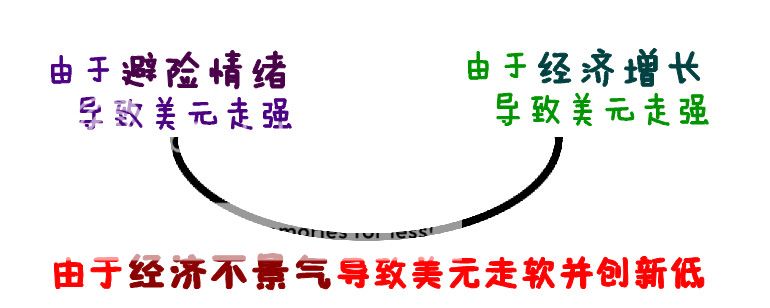
 | 情况1:由于美元是避险货币之一,世界的避险情绪会导致美元升值。微笑理论的第一部分,显示了美元怎么从全球的风险规避中受益,避险的情绪会导致投资者追逐“安全避风港”的货币,就像美元和日元。当投资者认为全球的经济状况不稳定时,他们会对高风险资产的投资犹豫不决,而宁愿买进相对安全的美元,并且不论美国当时的经济状况如何。 |
 | 情况2:美元持续的跌破新低。这是微笑理论的底部,反映了绿钞表现得暗淡无光,因为美国的经济不景气。 预期会降息的可能性,也会加强美元的下跌。 这些因素导致了市场抛售美元。投资者对于美元的座右铭,变成“卖!卖!卖!” |
 | 情况3:美元由于美国经济的增长而升值。最后,一个微笑开始形成,随着美国的经济开始恢复走强,投资者看见了希望的曙光。由于乐观情绪的回升,和经济出现的复苏迹象,投资者对美元的信心开始回升。 换句话说,由于美国经济的强劲GDP增长,和提高了对加息的预期,使得美元开始升值。 |
这个理论在2007年的金融危机时就开始运用了。还记得当时在全球经济衰退的时候,美元进入了繁盛的顶峰时期吗?这是微笑理论的第一阶段。
当金融市场在2009年3月时渡过了难关,投资者突然把美元切换回高收益的货币,使美元获得了2009年度的“最差货币”奖。
因此,美元微笑理论是否真的有效?
这只有时间才能告诉我们。
无论在任何的情况下,这是一个要牢记着的重要理论。记住,所有的经济都是周期性的。
最关键的是如何判断出,经济正处于它周期的哪个部分。