How to Use Bollinger Bands
Congratulations on making it to the 5th grade! Each time you make it to the next grade you continue to add more and more tools to your trader’s toolbox.
“What’s a trader’s toolbox?” you ask.
Simple!
Let’s compare trading to building a house. You wouldn’t use a hammer on a screw, right? Nor would you use a buzz saw to drive in nails. There’s a proper tool for each situation.
Just like in trading, some trading tools and indicators are best used in particular environments or situations. So, the more tools you have, the better you can adapt to the ever-changing market environment.
Or if you want to focus on a few specific trading environments or tools, that’s cool too. It’s good to have a specialist when installing your electricity or plumbing in a house, just like it’s cool to be a Bollinger Band or Moving Average expert.
There are a million different ways to grab some pips!
For this lesson, as you learn about these indicators, think of each as a new tool that you can add to that toolbox of yours.
You might not necessarily use all of these tools, but it’s always nice to have plenty of options, right? You might even find one that you understand and comfortable enough to master on its own. Now, enough about tools already!
Let’s get started!
Bollinger Bands
Bollinger Bands, a chart indicator developed by John Bollinger, are used to measure a market’s volatility.
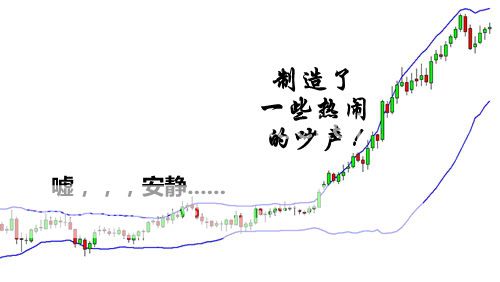
Basically, this little tool tells us whether the market is quiet or whether the market is LOUD! When the market is quiet, the bands contract and when the market is LOUD, the bands expand.
Notice on the chart below that when price is quiet, the bands are close together. When price moves up, the bands spread apart.

That’s all there is to it. Yes, we could go on and bore you by going into the history of the Bollinger Band, how it is calculated, the mathematical formulas behind it, and so on and so forth, but we really didn’t feel like typing it all out.
In all honesty, you don’t need to know any of that junk. We think it’s more important that we show you some ways you can apply the Bollinger Bands to your trading.
Note: If you really want to learn about the calculations of a Bollinger Band, then you can go to www.bollingerbands.com.
The Bollinger Bounce
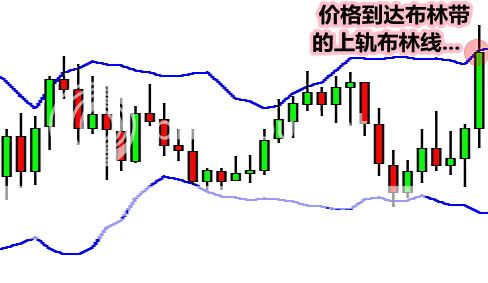
One thing you should know about Bollinger Bands is that price tends to return to the middle of the bands. That is the whole idea behind the Bollinger bounce. By looking at the chart below, can you tell us where the price might go next?

If you said down, then you are correct! As you can see, the price settled back down towards the middle area of the bands.

What you just saw was a classic Bollinger Bounce. The reason these bounces occur is because Bollinger bands act like dynamic support and resistance levels.
The longer the time frame you are in, the stronger these bands tend to be. Many traders have developed systems that thrive on these bounces and this strategy is best used when the market is ranging and there is no clear trend.
Now let’s look at a way to use Bollinger Bands when the market does trend.
Bollinger Squeeze
The Bollinger Squeeze is pretty self-explanatory. When the bands squeeze together, it usually means that a breakout is getting ready to happen.
If the candles start to break out above the top band, then the move will usually continue to go up. If the candles start to break out below the lower band, then price will usually continue to go down.

Looking at the chart above, you can see the bands squeezing together. The price has just started to break out of the top band. Based on this information, where do you think the price will go?

If you said up, you are correct again!
This is how a typical Bollinger Squeeze works.
This strategy is designed for you to catch a move as early as possible. Setups like these don’t occur every day, but you can probably spot them a few times a week if you are looking at a 15-minute chart.
There are many other things you can do with Bollinger Bands, but these are the 2 most common strategies associated with them. It’s time to put this in your trader’s toolbox before we move on to the next indicator.
布林带
祝贺你来到了第五级的课程! 每当你进入下一级,你就会为你的交易工具箱继续添加越来越多的工具。
“什么是交易者的工具箱啊?” 你问。
这个很简单!
就好比盖房子吧, 你不会用锤子来扭紧一颗螺丝, 也不会看到你用锯子来推动钉子,对不对? 所以说对于不同的情况,都要有一个适当的工具。
就像在交易中,一些工具和指标,只在特定的环境或情况变化之中,才能发挥最好的运用。 所以,你拥有的工具越多,你就可以更好的去适应,不断变化的市场趋势。
或者,如果你想将所有注意力只放在一些特别的交易时段或工具上,这也非常的好。就像你安装房子的电线或水管时,有专家协助你一样。这就像在交易中,你拥有布林线和移动平均线,这两位专家一样的好。
有成千上万种不同的方式来让你获取一些盈利!
在这课程,你会到这些指标,把它们每一种看成是一个新工具,然后您可以把它添加到你的工具箱中。
你不一定要使用所有工具,但拥有多种选择永远是最好的,对吗? 但你只需要找到一个能了解和使用舒适的,自己努力把它掌握熟悉。现在,工具说得够多啦!
让我们开始学习吧!
布林带
布林带是用来衡量一个市场的波动性的。
基本上,这个小工具可以告诉我们,市场是安静还是热闹的。当市场安静时,布林带缩小,当市场热闹时 ,布林带就扩大了。
注意在下面的图表中,当价格趋于平稳时,布林线是越缩越小的。 当价格上升时,布林线就分开了。
就是这么简单。 是的,我们继续学习下去,并进入到布林带的历史,看它是如何计算的,以及它背后的数学公式,等等。但我们真的不喜欢把所有的东西都写出来。
老实说,你是不需要知道这些垃圾信息的。 我们认为更重要的是一些,可以适用于交易的布林带用法。
注意:如果你真的想了解布林线是如何计算的,那么你可以点击 www.bollingerbands.com.
布林线的回落
有一件事你应该知道,那就是价格会习惯的回落到布林带的中间。 这是布林线回落的整个概念。 通过对下面图表的察看,你能告诉我们价格可能会走向哪里吗?
如果你说往下走,那么你是正确的! 正如你看到的,价格回落到布林线的中间地带。
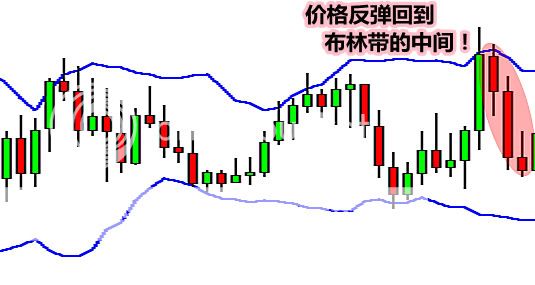
你刚才看到的是一个典型的布林线回落模式。 出现回落的原因,是因为这些布林线的位置,充当了动态的支持和阻力位。
你使用的时间周期越长,这些布林线的支撑阻力就越强劲。 许多交易者已经使用这类反弹,开发了很多的交易系统。尤其是当市场处于区间震荡和没有明显的趋势时候,这策略是最有效的方法。
现在让我们来看看当市场处于趋势的时候,布林线是如何使用的。
布林带的收缩
布林线的收缩是个不需要做解析的字眼。当布林线收缩越来越紧时,它通常意味着,一个突破的趋势即将要发生了。
如果这些蜡烛开始突破布林带上轨的话,突破后的价格经常是继续上升的。如果蜡烛开始突破布林带的下轨,突破后的价格经常是接着下降的。
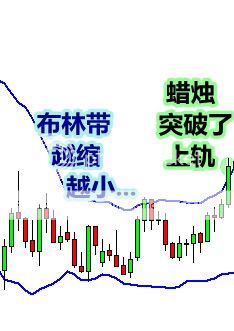
查看上述的图表,你可以看到布林带缩小了。而价格刚好开始突破布林带的上轨。 根据这些信息,你认为接下来价格将往什么方向去呢?
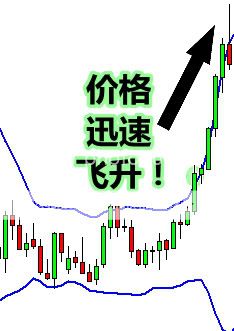
如果你回答价格是往上走,那么你又答对了!
这是布林带的收缩的典型例子。
这个策略的设计,可以让你尽早的抓住一个交易机会。像这样的交易机会不会每天都发生,但如果你在15分钟的图表上查看的话,也许会发现,他们可以每周都发生几次。
还有多种使用布林带的方法,但这是最常用的两个策略。在你学习下一个指标之前,是时候把它纳入你的工具箱了。
How to Use the MACD Indicator
MACD is an acronym for Moving Average Convergence Divergence. This tool is used to identify moving averages that are indicating a new trend, whether it’s bullish or bearish. After all, our top priority in trading is being able to find a trend, because that is where the most money is made.

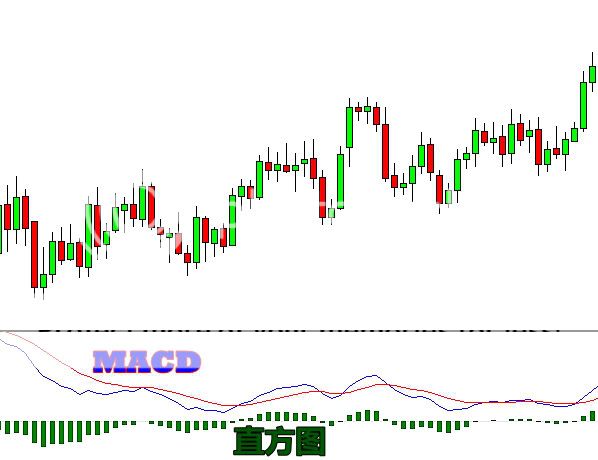
With an MACD chart, you will usually see three numbers that are used for its settings.
- The first is the number of periods that is used to calculate the faster moving average.
- The second is the number of periods that is used in the slower moving average.
- And the third is the number of bars that is used to calculate the moving average of the difference between the faster and slower moving averages.
For example, if you were to see “12, 26, 9″ as the MACD parameters (which is usually the default setting for most charting packages), this is how you would interpret it:
- The 12 represents the previous 12 bars of the faster moving average.
- The 26 represents the previous 26 bars of the slower moving average.
- The 9 represents the previous 9 bars of the difference between the two moving averages. This is plotted by vertical lines called a histogram (the green lines in the chart above).
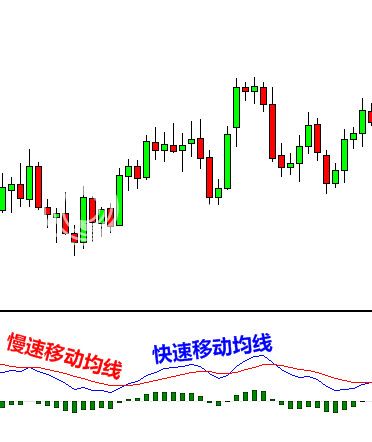
There is a common misconception when it comes to the lines of the MACD. The two lines that are drawn are NOT moving averages of the price. Instead, they are the moving averages of the DIFFERENCE between two moving averages.
In our example above, the faster moving average is the moving average of the difference between the 12 and 26-period moving averages. The slower moving average plots the average of the previous MACD line. Once again, from our example above, this would be a 9-period moving average.
This means that we are taking the average of the last 9 periods of the faster MACD line and plotting it as our slower moving average. This smoothens out the original line even more, which gives us a more accurate line.
The histogram simply plots the difference between the fast and slow moving average. If you look at our original chart, you can see that, as the two moving averages separate, the histogram gets bigger.
This is called divergence because the faster moving average is “diverging” or moving away from the slower moving average.
As the moving averages get closer to each other, the histogram gets smaller. This is called convergence because the faster moving average is “converging” or getting closer to the slower moving average.
And that, my friend, is how you get the name, Moving Average Convergence Divergence! Whew, we need to crack our knuckles after that one!
Ok, so now you know what MACD does. Now we’ll show you what MACD can do for YOU.
How to Trade Using MACD
Because there are two moving averages with different “speeds”, the faster one will obviously be quicker to react to price movement than the slower one.
When a new trend occurs, the fast line will react first and eventually cross the slower line. When this “crossover” occurs, and the fast line starts to “diverge” or move away from the slower line, it often indicates that a new trend has formed.

From the chart above, you can see that the fast line crossed under the slow line and correctly identified a new downtrend. Notice that when the lines crossed, the histogram temporarily disappears.
This is because the difference between the lines at the time of the cross is 0. As the downtrend begins and the fast line diverges away from the slow line, the histogram gets bigger, which is good indication of a strong trend.
Let’s take a look at an example.

From then, EUR/USD began shooting up as it started a new uptrend. Imagine if you went long after the crossover, you would’ve gained almost 200 pips!
There is one drawback to MACD. Naturally, moving averages tend to lag behind price. After all, it’s just an average of historical prices.
Since the MACD represents moving averages of other moving averages and is smoothed out by another moving average, you can imagine that there is quite a bit of lag. However, MACD is still one of the most favored tools by many traders.
M A C D 指标
MACD是 指数平滑异同移动平均线(Moving Average Convergence Divergence)的缩写。 这个工具是用来确认新趋势是牛市还是熊市。 毕竟,我们在交易时的首要任务就是发现趋势,因为那是拥有最多利润的地方。
使用一个MACD的指标,你通常会看到三个可以设定的参数。
• 第一个参数是用来设定速度较快的指数移动平均线EMA的周期。
• 第二个参字是用于设定速度较慢的指数移动平均线EMA的周期。
• 而第三个数字是用来平均,快线与慢线之间的差值。
例如,如果你看到MACD的指标参数为“12,26,9”(对于大多数图表,这是默认的设置),你可以如此解释它:
• 12 代表较快的指数移动平均线的周期参数是12。
• 26 代表较慢的指数移动平均线的周期参数是26。
• 9 则代表了,对12期 和 26期的两条均线之间的差值(MACD的快线),再进行9周期的平均(MACD的慢线)。它就是图表中的垂直线,称为直方图(上面图表中的绿线)。
对于MACD线 普遍存在一个误解,都以为那两条线 是价格的移动平均线。其实,它们是你看不到的两条指数移动平均线,之间的相差值。
在上面的例子中,较快的 那条MACD移动平均线,是12周期 和26周期,两条指数移动平均线的差值。而较慢的 那条MACD线,其实是较快的MACD线,再进行 9周期的平均后,得到的移动平均线。
这意味着,这条9周期的线,比我们之前 用12周期 和26周期,计算出来的那条MACD线,更加的平滑,这就给了我们一条更精确的平均线。
直方图简单地帮我们标出了,两条快与慢的MACD线之间的距离。如果你再看看刚才的那图表,你会发现,当两条MACD移动线f分开时,直方图变大了。
这称之为发散(diverging),因为较快的移动平均线正在“发散”或 远离较慢的移动平均线。
如果两条移动平均线互相贴近,那直方图就变小了。这称之为收敛(converging),因为较快的移动平均线真正收敛 或 越来越接近较慢的移动平均线。
如此等等,我的朋友,你现在知道Moving Average Convergence Divergence这名字的由来了吧! 哎呀,解释完这个 我们需要剩下懒腰才行!
好啦,所以现在你知道什么是MACD的了吧。那么我们现在将告诉你MACD指标可以为你做些什么吧。
如何使用MACD进行交易
因为有两条不同“速度”的移动平均线,较快速度的均线对价格的反应,明显比速度较慢的均线更快。
当新趋势发生时,较快的均线第一时间做出反应,并穿越较慢的均线。 当这种“交叉”发生时,快线开始“发散”或 远离慢线,这往往表明一个新的趋势已经形成。
从上面的图表,你可以看出,快线在慢线之下,确定了新的跌势。 注意,当两条线交叉时,直方图暂时消失了.
这是因为在字里行间的交叉时间差为0。 由于下跌趋势的开始和快线渐渐偏离慢线,直方图变得更大,这是一个良好的市场趋势的表现。
让我们来看一个例子。
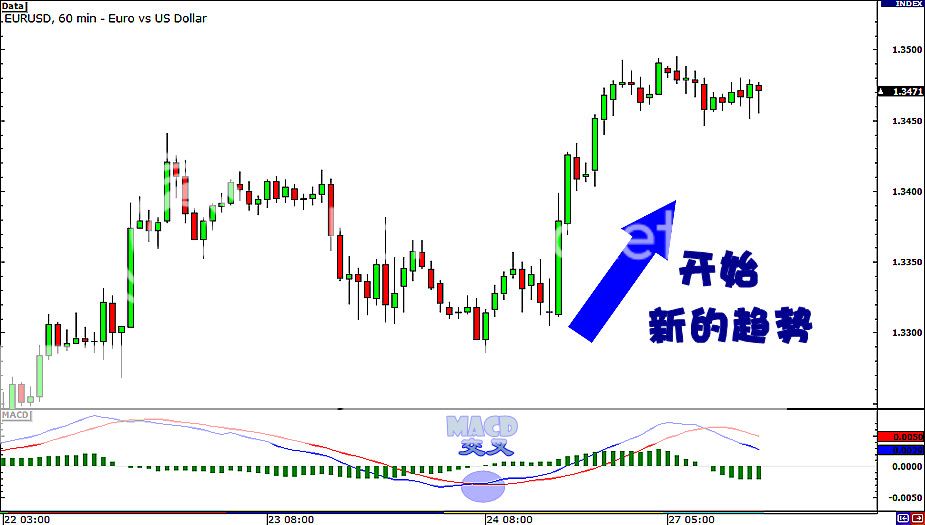
在上面 欧元/美元的1小时图表,快线向上穿过慢线,同时直方图消失了。这表明着,下跌的趋势将要扭转。
在那之后,欧元/美元 开始飞升,就像它开始了新的趋势。试想一下,如果你在交叉后 做了手多单,你应该已经赚了将近200点!
MACD线是存在一个缺点的,从本质上进,移动平均线本来就落后于价格。毕竟,它只是对历史的价格 进行平均。
由于MACD代表 对其他移动平均线的再平均,因此相对的更加平滑。你可以想象得到,它的滞后也相对的比较严重。不过,MACD指标仍是众投资者们青睐的工具之一。
How to Use Parabolic SAR
Up until now, we’ve looked at indicators that mainly focus on catching the beginning of new trends. Although it is important to be able to identify new trends, it is equally important to be able to identify where a trend ends. After all, what good is a well-timed entry without a well-timed exit?

One indicator that can help us determine where a trend might be ending is the Parabolic SAR (Stop And Reversal). A Parabolic SAR places dots, or points, on a chart that indicate potential reversals in price movement.
From the image above, you can see that the dots shift from being below the candles during the uptrend to above the candles when the trend reverses into a downtrend.
How to Trade Using Parabolic SAR
The nice thing about the Parabolic SAR is that it is really simple to use. We mean REALLY simple.
Basically, when the dots are below the candles, it is a buy signal.
When the dots are above the candles, it is a sell signal.

Simple?
Yes, we thought so.
This is probably the easiest indicator to interpret because it assumes that the price is either going up or down. With that said, this tool is best used in markets that are trending, and that have long rallies and downturns.
You DON’T want to use this tool in a choppy market where the price movement is sideways.
Using Parabolic SAR to exit trades
You can also use Parabolic SAR to help you determine whether you should close your trade or not.
Check out how the Parabolic SAR worked as an exit signal in EUR/USD’s daily chart above.

When EUR/USD started sliding down in late April, it seemed like it would just keep droppin’ like it’s hot. A trader who was able to short this pair has probably wondered how low it can go.
In early June, three dots formed at the bottom of the price, suggesting that the downtrend was over and that it was time to exit those shorts.
If you stubbornly decided to hold on to that trade thinking that EUR/USD would resume its drop, you would’ve probably erased all those winnings since the pair eventually climbed back near 1.3500.
SAR 抛物线指标
到目前为止,我们都集中在查看一些,力图一开始就抓住新趋势的指标上面。虽然确认 新趋势是非常重要的,但是能够找出该趋势的结束点,同样的重要。毕竟,一个好的进场时机,怎能少了一个好的出场时机?
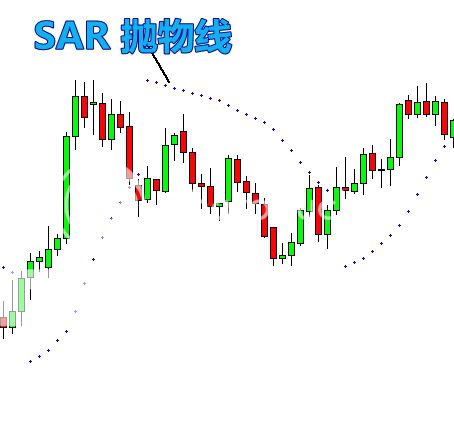
有一个指标可以帮助我们,确定一个趋势是否快要结束,它就是SAR(停止和反转 StopAndReversal)抛物线 。SAR抛物线将 一些小圆点,放在图表中 价格趋势可能会反转,的潜在位置。
从上图中,你可以看到 当趋势向上升时,小圆点在蜡烛线的下方,但当趋势反转向下跌时,小圆点立即移动到蜡烛线的上方去了。
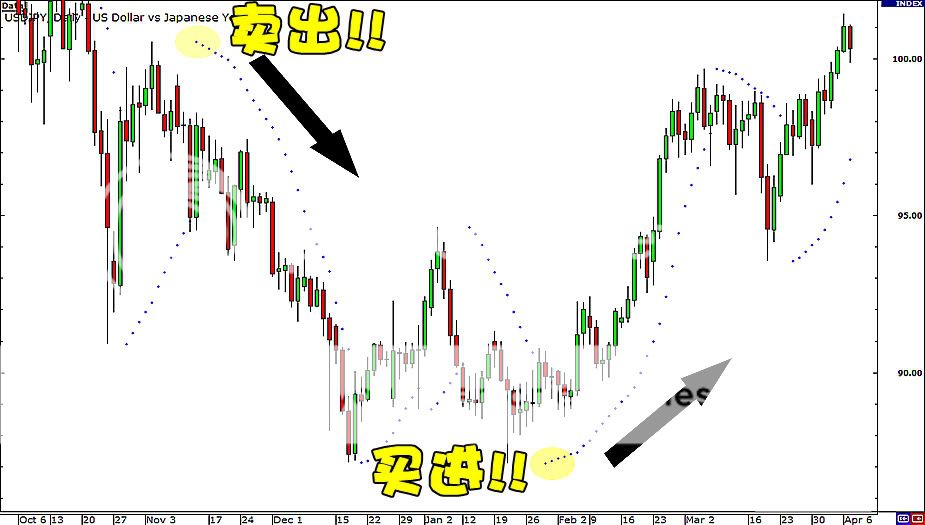
如何使用SAR抛物线来交易
抛物线的最大好处是,它非常简单易用。我们指的是 真正的 简单。
基本上,当小圆点在蜡烛线下方时,这是买入信号;而当小圆点在蜡烛线的上方时,这是卖出的信号。
简单吗?
是的,我们是这么认为的。
这可能是最容易解释的指标,因为它假定了 价格不是向上就是向下。根据这说法,这个工具最适合在,一个长期上涨 或 下跌的趋势市场中使用。
你 千万不要 在一个波涛汹涌的震荡市场,尤其是当价格横盘移动时,使用 此工具。
使用SAR抛物线来退出交易
您还可以使用SAR抛物线 来帮助您,确定您是否应该退出您的交易。
看看SAR抛物线,是如何在 欧元/美元 的日线图中,发出 退场的讯号。
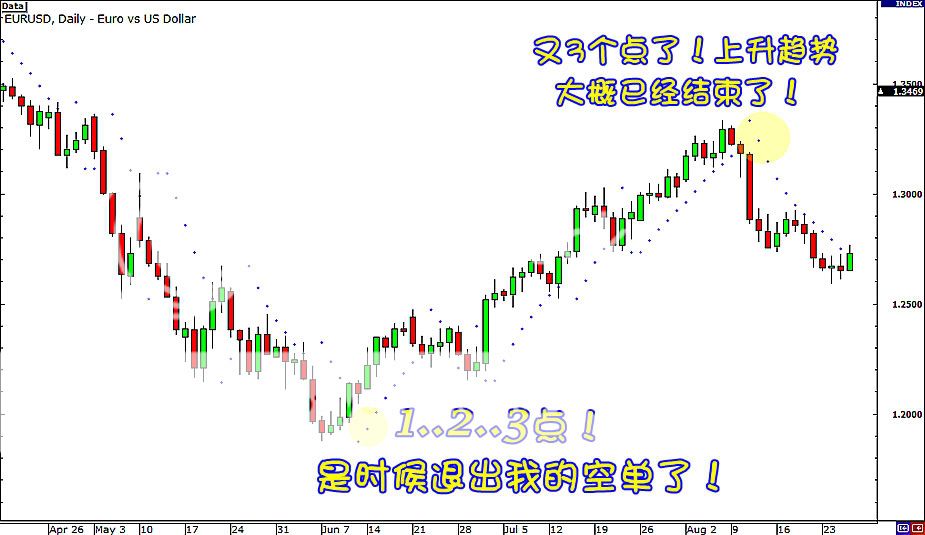
当欧元/美元从四月底 开始下滑以来,它似乎一直保持下降的趋势。有位交易者想 做空 这货币对,并且不知道它的趋势会跌到多低。
在六月初,三个小圆点在价格底部形成,表明下跌趋势已经结束,是时候退出那些空单了。
如果你固执地死守空单,并认为 欧元/美元 将恢复下跌,当价格最终攀升至1.3500 附近时,你大概已经失去所有赚到的钱了。
How to Use Stochastic
The Stochastic is another indicator that helps us determine where a trend might be ending.
By definition, a Stochastic is an oscillator that measures overbought and oversold conditions in the market. The 2 lines are similar to the MACD lines in the sense that one line is faster than the other.

How to Trade Using the Stochastic
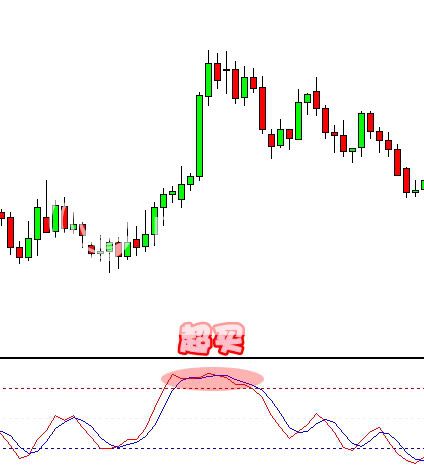
As we said earlier, the Stochastic tells us when the market is overbought or oversold. The Stochastic is scaled from 0 to 100.
When the Stochastic lines are above 80 (the red dotted line in the chart above), then it means the market is overbought. When the Stochastic lines are below 20 (the blue dotted line), then it means that the market is oversold.
As a rule of thumb, we buy when the market is oversold, and we sell when the market is overbought.

Looking at the chart above, you can see that the Stochastic has been showing overbought conditions for quite some time. Based on this information, can you guess where the price might go?

If you said the price would drop, then you are absolutely correct! Because the market was overbought for such a long period of time, a reversal was bound to happen.
That is the basics of the Stochastic. Many traders use the Stochastic in different ways, but the main purpose of the indicator is to show us where the market conditions could be overbought or oversold.
Over time, you will learn to use the Stochastic to fit your own personal trading style.
Okay, let’s move on to RSI.
随机振荡指标
随机振荡指标是另一个 帮助我们确定某一趋势是否结束的指标。
根据定义,随机振荡指标是个测量市场 超买 或超卖 的摆动器。两条类似于MACD的移动线,意味着一条比另一条要快得多。
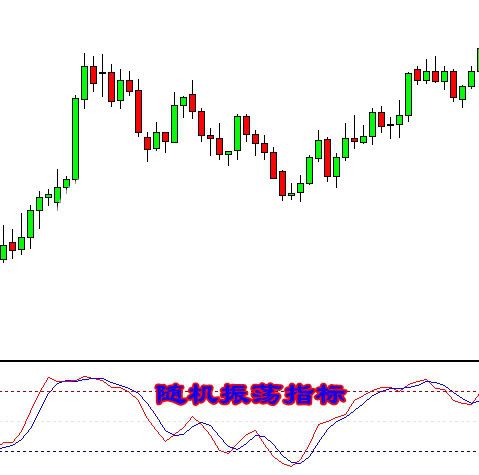
如何使用随机振荡指标 来进行交易
正如我们前面所说,随机指标告诉我们 市场是否处于 超买 或超卖 的状态。随机指标的刻度 是从 0 到100 。
当随机指标线大于80以上时(图表中的红色虚线),那就意味着市场处于超买的状态。当随机指标线小于20(那蓝色虚线),那就意味着市场处于超卖的状态。
根据大拇指定律,我们在市场处于超卖的状态做多 和 在市场处于超买的状态做空,这时候的风险最大,回报也是最丰厚的。
注意看上面的图表,你可以看到,随机指标已经相当长的一段时间呈现超买状态。根据这些信息,你能判断出 价格将往什么方向移动吗?
如果你说价格会下降,那么你是 绝对正确的!因为市场长期处于超买状态,那么一个反转将会发生。
这就是随机指标的基础知识。许多交易者以不同的方式 使用随机指标。但这指标的主要用处,是让我们知道市场,在什么时候处于超买 还是 超卖。
随着你经验的增长,你将根据自己的交易风格来使用随机指标。
好吧,让我们转移到 相对强弱指标 RSI 。
How to Use RSI (Relative Strength Index)
Relative Strength Index, or RSI, is similar to the stochastic in that it identifies overbought and oversold conditions in the market. It is also scaled from 0 to 100. Typically, readings below 30 indicate oversold, while readings over 70 indicate overbought.

How to Trade Using RSI
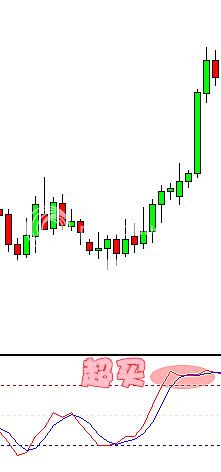
RSI can be used just like the stochastic. We can use it to pick potential tops and bottoms depending on whether the market is overbought or oversold.
Below is a 4-hour chart of EUR/USD.

EUR/USD had been dropping the week, falling about 400 pips over the course of two weeks.
On June 7, it was already trading below the 1.2000 handle. However, RSI dropped below 30, signalling that there might be no more sellers left in the market and that the move could be over. Price then reversed and headed back up over the next couple of weeks.
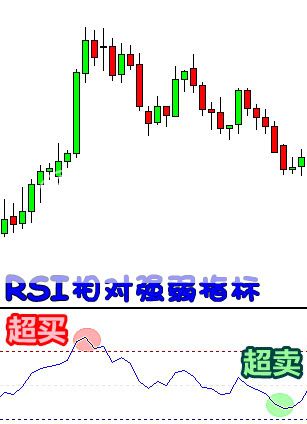
Determining the Trend using RSI
RSI is a very popular tool because it can also be used to confirm trend formations. If you think a trend is forming, take a quick look at the RSI and look at whether it is above or below 50.
If you are looking at a possible uptrend, then make sure the RSI is above 50. If you are looking at a possible downtrend, then make sure the RSI is below 50.

In the beginning of the chart above, we can see that a possible downtrend was forming. To avoid fake outs, we can wait for RSI to cross below 50 to confirm our trend. Sure enough, as RSI passes below 50, it is a good confirmation that a downtrend has actually formed.
相对强度指标
相对强度指标,简称RSI(Relative Strength Index),与随机振荡指标类似,它同样是用来确认市场,处于 超买 还是 超卖。它的刻度也是从0到100。通常情况下,低于30就是超卖,而超过70就是超买。
如何使用RSI来进行交易
RSI指标可以像随机振荡指标一样使用。我们根据市场是 超买 还是超卖,来寻找潜在的高点和低点。
以下是 欧元/美元 的4小时图表。
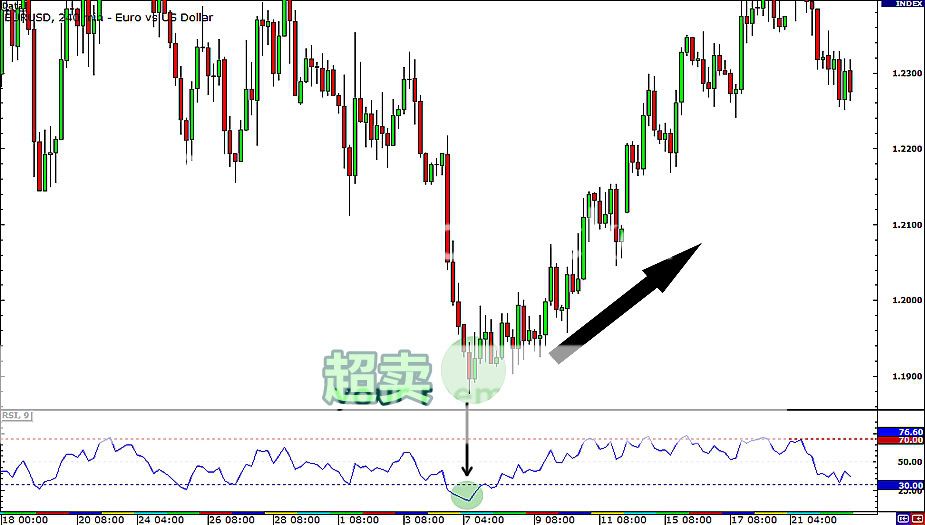
欧元/美元 已经下跌了整个星期,跌幅在两个星期内已超过约400点。
在6月7日,价格已经在1.2000形成杯柄形态。然而,RSI 已经跌至30以下,这表明 市场可能没有剩下 太多的卖家,而且趋势可能结束了。价格之后果然反转,调头连续上升了几个星期。
使用RSI来确认趋势的形成
RSI指标是一个非常受欢迎的工具,因为它也可以用来确认趋势的形成。如果你认为一个趋势正在形成,只需要快速的浏览一下RSI指标,看看它是否高于 或低于50。
如果你是在查看一个潜在的上升趋势,那么确保RSI高于50。如果你是在查看一个潜在的下跌趋势,那么确保RSI低于50。
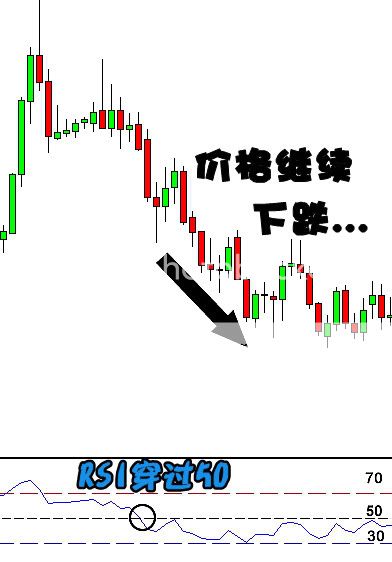
在上面图表的初期,我们可以看到一个潜在的下跌趋势正在形成。为了避免假讯号,我们可以等待 RSI指标向下穿过50后 才确认我们的趋势。果然如此,当RSI 下穿50 后,这是对下跌趋势的形成,最好的确认方法。
How to Use ADX (Average Directional Index)
The Average Directional Index, or ADX for short, is another example of an oscillator. It fluctuates from 0 to 100, with readings below 20 indicating a weak trend and readings above 50 signaling a strong trend.
Unlike the stochastic, ADX doesn’t determine whether the trend is bullish or bearish. Rather, it merely measures the strength of the current trend. Because of that, ADX is typically used to identify whether the market is ranging or starting a new trend.
Take a look at these neat charts we’ve pulled up:

And would you look at that! EUR/CHF broke below the bottom of the range and went on a strong downtrend. Ooh, that’d be around 400 pips in the bag.
Book it, baby!
Now, let’s look at this next example:

Tada!
A strong uptrend took place. That’d be 300 pips, signed, sealed, and delivered!
Looks simple enough, right?
If there’s one problem with using ADX, it’s that it doesn’t exactly tell you whether it’s a buy or a sell. What it does tell you is whether it’d be okay to jump in an ongoing trend or not.
Once ADX starts dropping below 50 again, it could mean that the uptrend or downtrend is starting to weaken and that it might be a good time to lock in profits.
How to Trade Using ADX
One way to trade using ADX is to wait for breakouts first before deciding to go long or short. ADX can be used as confirmation whether the pair could possibly continue in its current trend or not.
Another way is to combine ADX with another indicator, particularly one that identifies whether the pair is headed downwards or upwards.
ADX can also be used to determine when one should close a trade early.
For instance, when ADX starts to slide below 50, it indicates that the current trend is losing steam. From then, the pair could possibly move sideways, so you might want to lock in those pips before that happens.
趋势强度指标
趋势强度指标,简称ADX,是另一种摇摆器。它的波动指数从0到100,当指数低于20表明趋势疲弱,高于50表明着趋势强劲。
和RSI不同的是,ADX不是用来判断趋势的上升或下跌。它只是用来衡量目前趋势的强度。正因为如此,ADX通常用来识别现在的市场,究竟是震荡 还是一个新的趋势开始。
看看下图表中,我们框起来的部分:
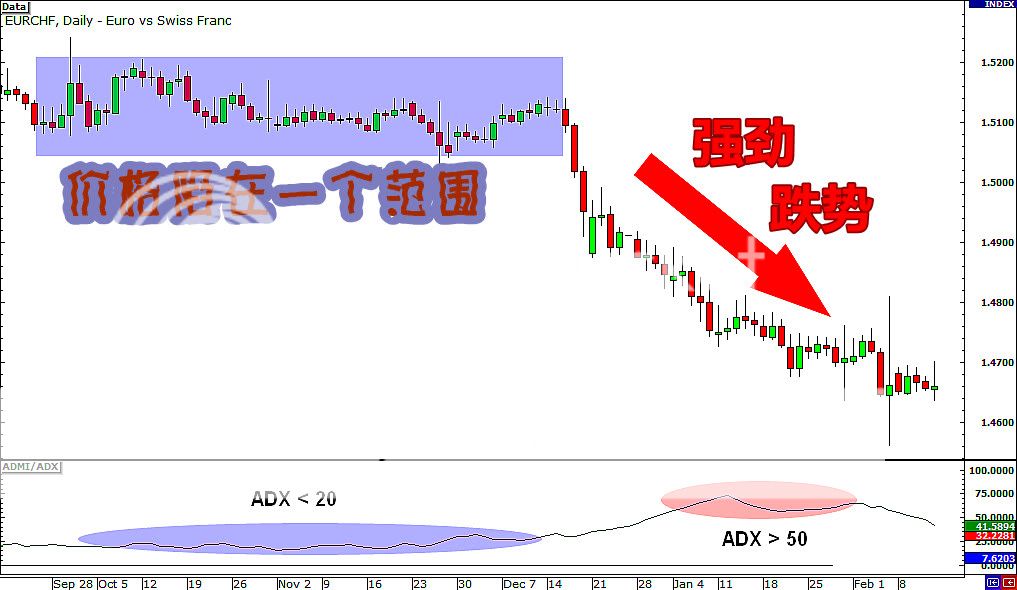
在第一个例子,ADX指数 从9月下旬至十二月初,都低于20。正如你从图中可以看到的,欧元/瑞郎 在这段时间内被困在一个范围中。直到一月初,ADX指数开始攀升至50以上,这表明一个强烈的趋势可能在等待时机。
然后你看发生什么事! 欧元/瑞郎跌破振荡范围的底部,强大的跌势来了。噢,那大约可以赚进400点。
宝贝,快下单吧!
现在,让我们来看看下一个例子:
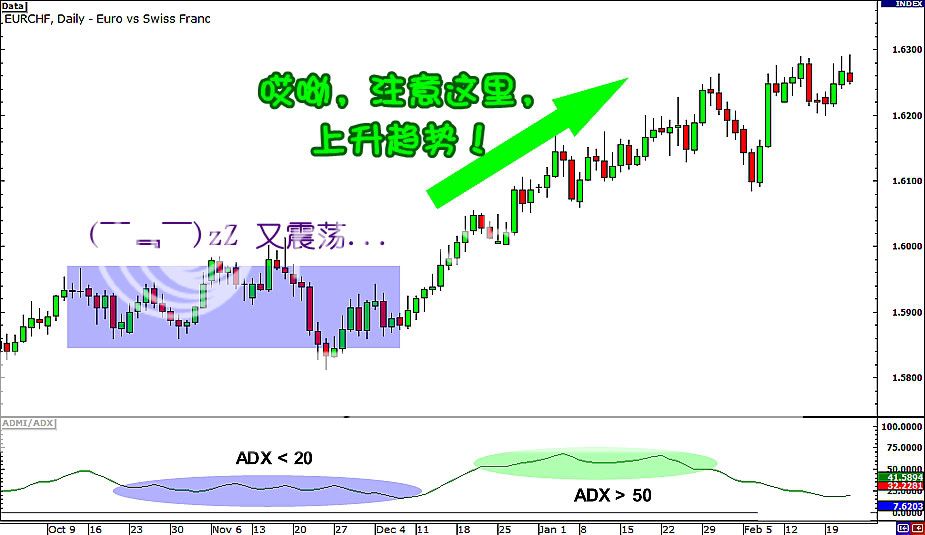
就像我们的第一个例子,ADX在低于指数20的范围,徘徊了好一阵子。同时,欧元/瑞郎也一直在振荡。很快,ADX升起至50以上,欧元/瑞郎 也突破了它振荡范围的顶部。
嗒-哒-哒!(敲门声)
一个强劲的升势送到咯。这可高达300个点,来。。。签名,盖章 然后 交货!
看起来很简单,对吧?
使用ADX也有一个问题,那就是它不会告诉你该 买入 还是 卖出。它告诉你的是,现在这趋势的强度,是否适合下单。
一旦ADX开始下降低于50,这可能意味着上升趋势或下降趋势已经开始减弱,这可能是一个锁定利润的好时机。
如何使用ADX进行交易
使用ADX进行交易的方法是,等待突破之后,才决定是 做多 还是 做空。ADX可以用来确认,该货币对的趋势 能否继续下去。
使用ADX的另一个方法 是与其他的指标一起使用,尤其是 哪些可以确定货币对的价格,是向上还是向下的指标。
ADX也可用于确定,是否应该尽早平单出场。
举个例如,当ADX开始低于50时,则表明目前的趋势正在失去动力。之后,该货币对可能会振荡移动,所以你可能会在振荡发生之前锁定仓位。
Ichimoku Kinko Hyo
Yes, you’re still in the right place. You’re still in the School of Pipsology and not in some Japanese pop fan girl site (although Huck may disagree with the rest of the FX-Men on that). No, “Ichimoku Kinko Hyo” ain’t Japanese for “May the pips be with you.” but it can help you grab those pips nonetheless.
Ichimoku Kinko Hyo (IKH) is an indicator that gauges future price momentum and determines future areas of support and resistance. Now that’s 3-in-1 for y’all! Also know that this indicator is mainly used on JPY pairs.
To add to your Japanese vocab, the word ichimoku translates to “a glance”, kinko means “equilibrium”, while hyo is Japanese for “chart.” Putting that all together, the phrase ichimoku kinko hyo stands for “a glance at a chart in equilibrium.” Huh, what does all that mean?
A chart might make things easier to explain…

Whoops. That didn’t help. A few more lines and this’ll resemble a seismograph.
Before you go off and call this gibberish, let’s try to find out what each of the lines is for.
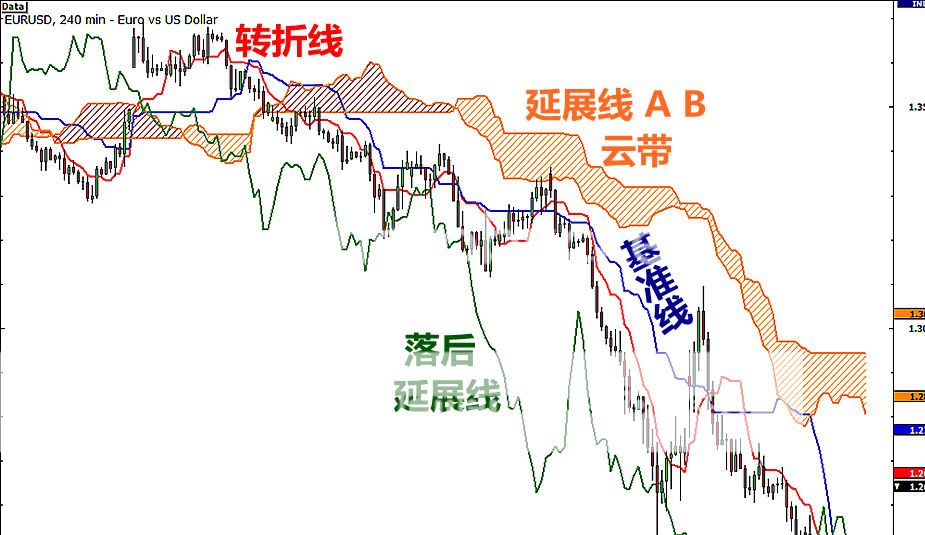
Kijun Sen (blue line): Also called standard line or base line, this is calculated by averaging the highest high and the lowest low for the past 26 periods.
Tenkan Sen (red line): This is also known as the turning line and is derived by averaging the highest high and the lowest low for the past nine periods.
Chikou Span (green line): This is called the lagging line. It is today’s closing price plotted 26 periods behind.
Senkou Span (orange lines): The first Senkou line is calculated by averaging the Tenkan Sen and the Kijun Sen and plotted 26 periods ahead. The second Senkou line is determined by averaging the highest high and the lowest low for the past 52 periods and plotted 26 periods ahead.

How to Trade Using Ichimoku Kinyo Hyo
Let’s take a look at the Senkou span first.
If the price is above the Senkou span, the top line serves as the first support level while the bottom line serves as the second support level.
If the price is below the Senkou span, the bottom line forms the first resistance level while the top line is the second resistance level. Got it?
Meanwhile, the Kijun Sen acts as an indicator of future price movement. If the price is higher than the blue line, it could continue to climb higher. If the price is below the blue line, it could keep dropping.
The Tenkan Sen is an indicator of the market trend. If the red line is moving up or down, it indicates that the market is trending. If it moves horizontally, it signals that the market is ranging.
Lastly, if the Chikou Span or the green line crosses the price in the bottom-up direction, that’s a buy signal. If the green line crosses the price from the top-down, that’s a sell signal.
Here’s that line-filled chart once more, this time with the trade signals:

It sure looks complicated at first but this baby’s got support and resistance levels, crossovers, oscillators, and trend indicators all in one go! Amazing, right?
Okey dokey, we’ve already covered a smorgasbord of indicators. Let’s see how we can put all of what you just learned together…
一目均衡表
是的,你仍然在正确的地方。你仍然在BabyPips学校,而不是在一些日本流行粉丝女孩的网站(或许你学长哈克和其他男同学可能有其他念头)。不是的,尽管Ichimoku Kinko Hyo不是日本绝地武士,不能“愿点数与你同在”,但它多多少少可以帮你捞到一些点数。
Ichimoku Kinko Hyo(IKH)是一个指标,用来计算价格未来的趋势,和确认未来的支撑和阻力位在哪儿。所以这是给大家的 三合一 指标。你也要知道,这个指标主要用于 日币货币对。
把它加进您的日语词库里,这个词 Ichimoku 翻译成“瞟一眼”,Kinko的意思是“平衡”,而 Hyo是日本“图表”的意思。 把所有的加在一起,这句话 Ichimoku Kinko Hyo表示“对市场趋势,一目了然的图表” 咦,这一切意味着什么?
图表可以让事情变得更容易解释…
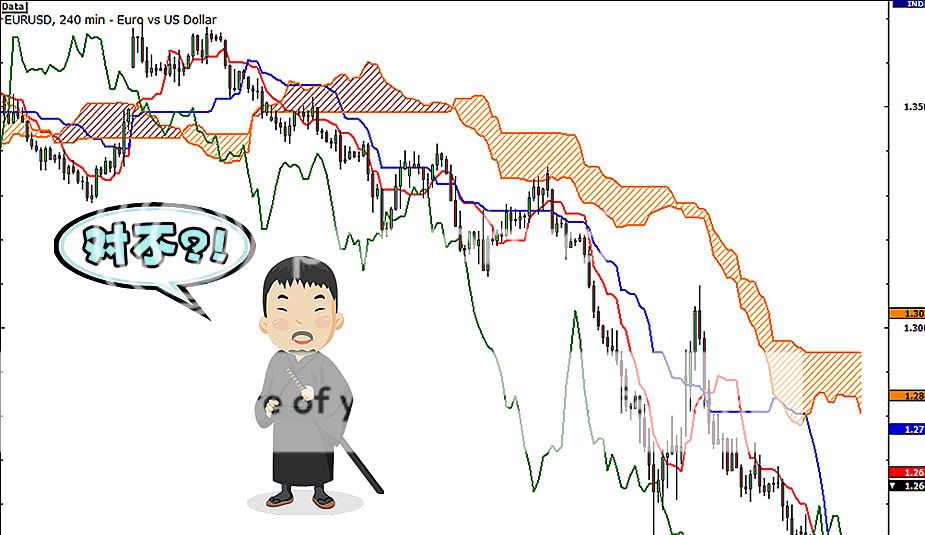
哎呀。图表并没有帮助。一堆的线,这看起来就像是地震仪。
在你放弃 和 称这鬼画符之前,让我们先尝试找出 每一条线的用途。
Kijun Sen (蓝线):称为基准线或底线,这是计算过去 26周期的最高价与最低价的平均值。
Tenkan Sen(红线):这被称为转折线,这是计算过去 9周期的最高价与最低价的平均值。
Chikou Span (绿线):这是所谓的落后延展线。使用用蓝线的周期,把今天的收盘价 往后移。
Senkou Span (橙色线、云带):延展线A 是,蓝线 和 红线的 平均值。
延展线B 是由过去52个周期的最高价和最低价的平均值,并使用蓝线的周期,把两条线 往前移。
明白了吗?嗯,它不是真的要你记住每一条线是如何计算的。更重要的是让你理解这些五花八门的线。
如何使用一目均衡表来进行交易
让我们首先看一看 云带。
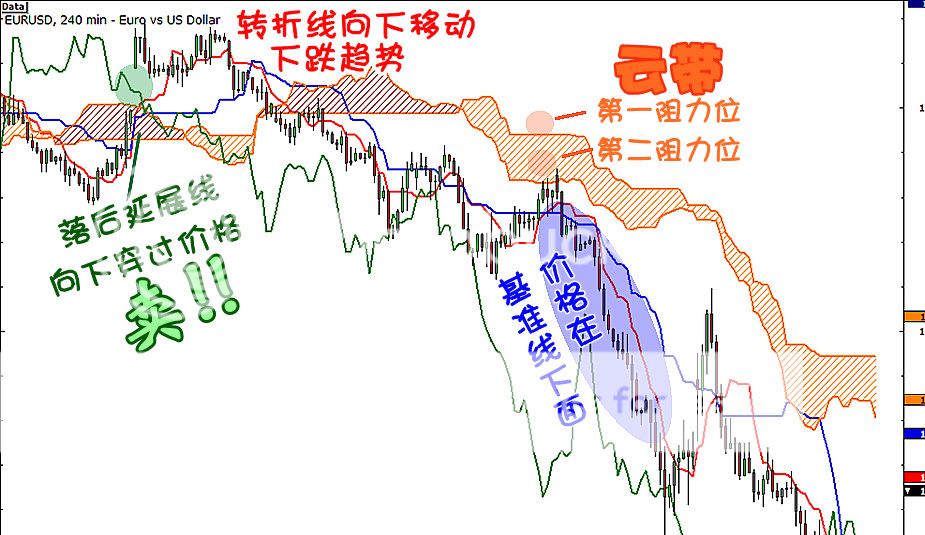
如果价格高于 云带,顶线作为第一个支撑位,而底线作为第二个支撑位。
如果价格低于 云带,底线形成第一阻力水平,而顶线是第二个阻力位。明白了吗?
同时,基准线 充当未来价格走势的指标。如果价格比 基准线高,它可能继续攀升至更高。如果价格低于基准线,它可以不断下降。
转折线 是对市场趋势的指标。 不论转折线 是向上还是向下 都表明这是趋势市场。如果水平移动,它表示市场是振荡的。
最后,如果 落后延展线 自下而上地穿越价格,这就是一个 买入信号。如果绿线自上而下地穿越价格,这是一个卖出信号。
这又是个 满是线条的图表,这次加上了交易的信号:
它一开始时看起来很复杂,支持和阻力位,交叉,振荡器 和 趋势指标都在一个图表里!太神了,对不?
好好,没问题,我们刚吃了一个指标的大杂烩。让我们看看 如何能把你刚学的,全放在一起 ……
Trading with Multiple Chart Indicators
Now that you know how some of the most common chart indicators work, you’re ready to get down and dirty with some examples. Better yet, let’s combine some of these indicators and see how their trade signals pan out.
In a perfect world, we could take just one of these indicators and trade strictly by what that indicator told us. The problem is that we DON’T live in a perfect world, and each of these indicators has imperfections.
That is why many traders combine different indicators together so that they can “screen” each other. They might have 3 different indicators and they won’t trade unless all 3 indicators give them the same signal.
In this first example, we’ve got the Bollinger bands and the Stochastic on EUR/USD’s 4-hour chart. Since the market seems to be ranging or moving sideways, we’d better watch out for the Bollinger bounce.

Check out that those sell signals from the Bollinger bands and the Stochastic. EUR/USD climbed until the top of the band, which usually acts as a resistance level.
At the same time, the Stochastic reached the overbought area, suggesting that the price could drop down soon.
And what happened next?
EUR/USD fell by around 300 pips and you would’ve made a hefty profit if you took that short trade.
Later on, the price made contact with the bottom of the band, which usually serves as a support level. This means that the pair could bounce up from there. With the Stochastic in the oversold area, it means we should go long.
If you took that trade, you would have gotten around 400 pips! Not bad!
Here’s another example, with the RSI and the MACD this time.

When the RSI reached the overbought area and gave a sell signal, the MACD soon followed with a downward crossover, which is also a sell signal. And, as you can see, the price did move downhill from there.
Hooray for multiple indicators!
Later on, the RSI dipped to the oversold region and gave a buy signal. A few hours after, the MACD made an upward crossover, which is also a buy signal. From there, the price made a steady climb. More pips for us, yipee!
You probably noticed in this example that the RSI gives signals ahead of the MACD. Because of the various properties and magic formulas for the technical indicators, some really do give early signals while others are a bit delayed.
You’ll learn more about this in sixth grade.
As you continue your journey as a trader, you will discover which indicators work best for you. We can tell you that we like using MACD, the Stochastic, and RSI, but you might have a different preference.
Every trader out there has tried to find the “magic combination” of indicators that will give them the right signals all the time, but the truth is that there is no such thing.
We urge you to study each indicator on its own until you know the tendencies of how it behaves relative to price movement, and then come up with your own combination that you understand and that fits your trading style.
Later on in the course, we will show you an example of a system that combines different indicators to give you an idea of how they can complement each other.
利用多指标结合交易
现在你已经学会一些,最常见的指标是如何使用的,你是否已经准备踏踏实实的,在一些例子中努力练习呢。还有更妙的,让我们把这些指标结合起来,然后看看他们会烘烤出什么样的交易信号。
在一个完美的世界里,我们只需要使用一种指标,然后按照指标给出的讯号,进行交易就行了。但问题是,我们 没有 一个完美的世界,而那些指标每一个都各有缺陷。
这就是为什么许多交易者把不同的指标,结合在一起使用的原因,这样它们可以互相的“ 监督 ”。一般他们可能会用 3种 不同类型的指标,除非 3种指标 都给出了相同的讯号,否则他们不会进行交易。
在这第一个例子中,我们在 欧元/美元的 4小时图表内,加入 布林线和 随机振荡指标。由于市场看起来,开始进入振荡 或 横盘 的走势,我们最好把注意力放在 布林线的 反弹。
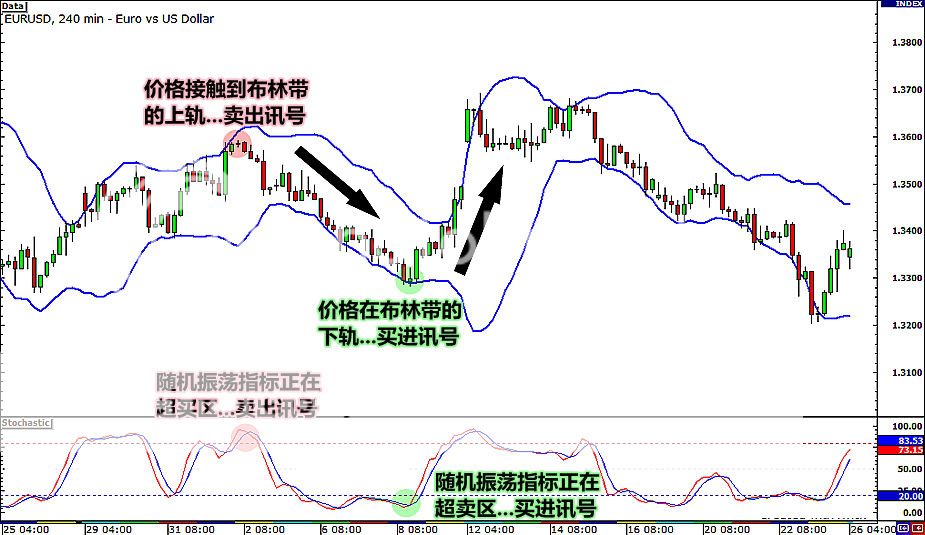
查看这些 布林带和 随机指标 的卖出信号。欧元/美元 攀升到了布林线的上轨,通常它的反应就像遇到了阻力位。
在同一时间,随机振荡指标进入了超买区,暗示着价格可能会 快速的下滑。
接下来发生了什么事?
欧元/美元下跌了约300点,如果你采取了短线的交易,你已经得到丰厚的利润了。
迟些时刻,价格接触到了布林带的下轨,这通常会是一个支撑位的反应。这意味着,货币对可能在那里弹起。接着随机指标进入超卖区,它意味着我们可以做买单。
如果你已经交易了,你会得到大约400点!不错吧!
下面是另一个例子,这次使用 RSI 和 MACD 指标。
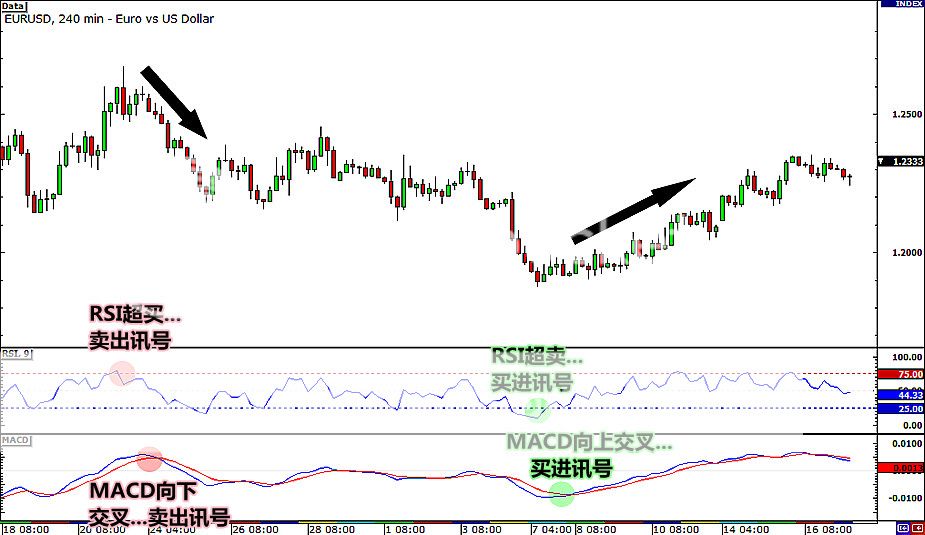
当RSI进入超买区并给出做空信号时,MACD随后也出现了向下交叉,这也是一个做空信号。而且,正如你看到的,价格这时也走下坡路了。
我们的指标万岁!
迟些时刻,RSI指标跌至超卖区,给出了一个做多信号。几个小时后,MACD开始交叉向上,这也是一个做多的信号。这时,价格开始稳定地攀升。这意味着我们赚钱了,耶!
您可能会注意到在这个例子中,RSI比MACD更快的给出信号。 因为每个技术指标的属性和神奇的公式都不相同,所以有些会提早给人信号,而其他的一般都有些滞后。
您将在初中的课程中学习这一些。
当你继续交易者的旅程后,将来你会发觉哪些指标最适合你。虽然我们可以告诉你,我们喜欢使用MACD、随机振荡指标 和RSI,但你可能有不同的偏好。
每个刚从这里结束小学课程的交易者,都试图在寻找“神奇组合”的万能指标,就是在任何时间,都能给予他们正确的信号。但事实是,根本没有这样的东西。
我们敦促你对每个指标,单独的进行研究。直到你清楚它,在价格的趋势变动时,会有什么反应。这样你才能组合出,一个 自己 了解和适合自己交易风格的指标系统。
之后的课程,我们将向您展示一个,结合不同的指标的系统例子。这会让您对各种指标的互补,有更好的了解。
Summary of Popular Chart Indicators

Everything you learn about trading is like a tool that is being added to your forex trader’s toolbox. Your tools will give you a better chance of making good trading decisions when you use the right tool at the right time.
Bollinger Bands
- Used to measure the market’s volatility.
- They act like mini support and resistance levels.
Bollinger Bounce
- A strategy that relies on the notion that price tends to always return to the middle of the Bollinger bands.
- You buy when the price hits the lower Bollinger band.
- You sell when the price hits the upper Bollinger band.
- Best used in ranging markets.
Bollinger Squeeze
- A strategy that is used to catch breakouts early.
- When the Bollinger bands “squeeze”, it means that the market is very quiet, and a breakout is eminent. Once a breakout occurs, we enter a trade on whatever side the price makes its breakout.
MACD
- Used to catch trends early and can also help us spot trend reversals.
- It consists of 2 moving averages (1 fast, 1 slow) and vertical lines called a histogram, which measures the distance between the 2 moving averages.
- Contrary to what many people think, the moving average lines are NOT moving averages of the price. They are moving averages of other moving averages.
- MACD’s downfall is its lag because it uses so many moving averages.
- One way to use MACD is to wait for the fast line to “cross over” or “cross under” the slow line and enter the trade accordingly because it signals a new trend.
Parabolic SAR
- This indicator is made to spot trend reversals, hence the name Parabolic Stop And Reversal (SAR).
- This is the easiest indicator to interpret because it only gives bullish and bearish signals.
- When the dots are above the candles, it is a sell signal.
- When the dots are below the candles, it is a buy signal.
- These are best used in trending markets that consist of long rallies and downturns.
Stochastic
- Used to indicate overbought and oversold conditions.
- When the moving average lines are above 80, it means that the market is overbought and we should look to sell.
- When the moving average lines are below 20, it means that the market is oversold and we should look to buy.
Relative Strength Index (RSI)
- Similar to the stochastic in that it indicates overbought and oversold conditions.
- When RSI is above 70, it means that the market is overbought and we should look to sell.
- When RSI is below 30, it means that the market is oversold and we should look to buy.
- RSI can also be used to confirm trend formations. If you think a trend is forming, wait for RSI to go above or below 50 (depending on if you’re looking at an uptrend or downtrend) before you enter a trade.
Average Directional Index (ADX)
- The ADX calculates the potential strength of a trend.
- It fluctuates from 0 to 100, with readings below 20 indicating a weak trend and readings above 50 signaling a strong trend.
- ADX can be used as confirmation whether the pair could possibly continue in its current trend or not.
- ADX can also be used to determine when one should close a trade early. For instance, when ADX starts to slide below 50, it indicates that the current trend is possibly losing steam.
Ichimoku Kinko Hyo
- Ichimoku Kinko Hyo (IKH) is an indicator that gauges future price momentum and determines future areas of support and resistance.
- Ichimoku translates to “a glance”, kinko means “equilibrium”, while hyo is Japanese for “chart”. Putting that all together, the phrase ichimoku kinko hyo stands for “a glance at a chart in equilibrium.”
- If the price is above the Senkou span, the top line serves as the first support level while the bottom line serves as the second support level. If the price is below the Senkou span, the bottom line forms the first resistance level while the top line is the second resistance level.
- The Kijun Sen acts as an indicator of future price movement. If the price is higher than the blue line, it could continue to climb higher. If the price is below the blue line, it could keep dropping.
- The Tenkan Sen is an indicator of the market trend. If the red line is moving up or down, it indicates that the market is trending. If it moves horizontally, it signals that the market is ranging.
- The Chikou Span is the lagging line. If the Chikou line crosses the price in the bottom-up direction, that’s a buy signal. If the green line crosses the price from the top-down, that’s a sell signal.
Each chart indicator has its imperfections. This is why forex traders combine many different indicators to “screen” each other. As you progress through your trading career, you will learn which indicators you like the best and can combine them in a way that fits your forex trading style.
总结:常用图形指标

PS:常用图形指标有,布林带、MACD、随机指标、RSI指标、ADX指标以及一目均衡图。
你现在每多学习一项技能,就意味着你的外汇交易工具箱里面多了一种工具。你所拥有的交易工具将助你增强交易的胜算,让你在合适的时候使用合适的工具。
布林带
使用布林带的目的在于衡量市场的波动性。
它们扮演着迷你支撑位和阻力位角色。
布林带反弹
价格倾向于回归至布林带的中部。这是布林带反弹的精华。
当价格触及布林带底部,倾向于买入。
当价格触及布林带顶部,倾向于卖出
当市场处于区间波动且无明显波动方向时,使用这一交易系统是最好的策略之一。
布林带挤轧
该策略用来捕捉早期突破行情的到来。
当布林带挤轧在一起时,这意味着市场交投非常清淡。一旦突破行情出现,价格朝任何方向突破都有可能。
抛物转向线指标
抛物转向指标由有序排列的一个个小点组成,它能够预示价格可能存在潜在的反转。
抛物转向指标的优点在于,他实际上非常易于使用。真的非常简单。
一般来说,当小点在蜡烛线下方时,这是买入信号;当小点在蜡烛线上方时,这是卖出信号。
抛物转向线指标在市场处于明显的趋势中使用效果最佳,尤其是在长上升或下跌趋势中。
RSI指标
RSI指标范围介于0-100之间。通常来说,读数低于30意味着买卖,高于70意味着超买。
RSI指标能够和随机指标一样使用。我们能够用它来找出潜在的顶部和底部,判断标准为市场是否处于超买或超卖。
RSI指标是一个非常流行的工具,因为我们也能够利用它来确定趋势的形成。如果你认为趋势正在形成,我们可以看RSI指标是突破还是跌破50关口。
ADX指标
ADX指标并不决定某一趋势是牛市还是熊市。它仅仅只是衡量当前趋势的强弱程度。有鉴于此,ADX指标通常被用来决定,市场是否处于区间波动,或正开始一轮新趋势。
它的值介于0-100之间,读数低于20意味着趋势的疲软,而读数高于50则发出趋势变强的信号。
ADX指标并不能明确的告诉你,应该是买进还是卖出。它所告诉你的只是,汇价是否将会开启一轮强劲的趋势。
一旦ADX开始再次跌破50,它可能意味着,上升趋势或下降趋势正开始走弱,而这时也可能是时候选择锁定获利了。
一目均衡图
一目均衡图(Ichimoku Kinko Hyo,IKH)指标用来衡量价格未来的走势趋向并决定未来的支撑和阻力区域。该指标主要用在日元货币对上。
Ichimoku一目译作简单,而Kinko则为均衡之意,Hyo则是日文图表的意思。Ichimoku Kinko Hyo可以译为利用图表来透视平衡点,从而捕捉走势及入场时机。
如果价格突破前移指标,那么前移指标A将扮演第一支撑位角色,而前移指标B将扮演第二支撑位角色。
如果价格跌破前移指标,那么迁移指标B将扮演第一阻力位角色,而前移指标A将扮演第二阻力位角色。了解了吗?
同时,中轴慢线将作为未来价格运动指标。如果价格高于中轴慢线,价格可能进一步攀升。如果价格低于中轴慢线,它可能持续下跌。
而转换线则作为衡量市场趋势的指标。如果短轴快线走高或走低,那么它就显示市场处于趋势运动中。如果短轴快线水平移动,则意味着市场处于区间波动。
最后,如果后移指标在底部上行方向上穿价格线,它即发出买入信号。如果后移指标在顶部下行方向下穿价格线,则发出卖出信号。