Know Your Trading Environment
When two people go to war, the foolish man always rushes blindly into battle without a plan, much like a starving man at his favorite buffet spot.
The wise man, on the other hand, will always get a situation report first to know the surrounding conditions that could affect how the battle plays out.

Like in warfare, we must also get a situation report on trading environment. This means we need to know what kind of market environment we are actually in. Some forex traders cry saying that their system sucks.
Sometimes the system does in fact…suck. Other times, the system is potentially profitable, but it is being utilized in the wrong trading environment.
Seasoned forex traders try to figure out the appropriate strategy for the current market environment they are trading in.
Is it time to bust out those Fibs and look for retracements? Or are ranges holding?
Just as the coach comes up with different plays for particular situations or opponents, you should also be able to decide which strategy to use depending on trading environment.
By knowing what market environment we are trading in, we can choose a trend-based strategy in a trending market or a range-bound strategy in a ranging market.
Are you worried about not getting to use your beastly range-bound strategy? How about your Bring-Home-Da-Bacon trend-based system?
Have no fear!
The forex market provides many trending and ranging opportunities across different time frames wherein these strategies can be implemented.
By knowing which strategies are appropriate, you will find it easier to figure out which indicators to pull out from your forex toolbox.
For instance, Fibs and trend lines are useful in trending markets while pivot points, support and resistance levels are helpful when the market is ranging.
Before spotting those opportunities, you have to be able to determine the trading environment. The state of the market can be classified into three scenarios:
- Trending up
- Trending down
- Ranging
掌握趋势
战场中总是有两种人,一种是无知的人,永远没有计划就盲目地投入战斗中,就像是一个饿鬼见到他最喜爱的自助餐一样。
另一种精明的人,总是相反的,永远会率先取得一份形势报告,仔细了解各种会影响战况的周边条件。

就像在战争中一样,当我们交易时,也必须先得到市场上的趋势报告。 这意味着我们需要先知道,现在我们正处于什么样的市场环境下。
不少交易者们时常哭诉着说他们的系统太烂了。有的时候,那系统确实是很糟糕,但另一些时候,那系统却具有潜在的盈利机会,只是它被使用在错误的环境中了。
经验丰富的交易者们,都试图在当前的市场环境中,寻求合适的策略。
是时候止损点数出局,另外寻找下单机会?或者只是止损范围内的回测?
正如教练会根据不同的对手和特定的情况,而改变战术。你也应该根据市场的环境,而决定使用什么样的策略。
通过了解我们交易时,正处的市场环境。我们可以在一个趋势市场中,使用趋势跟踪的策略;或在震荡市场中,使用区间反弹的策略。
你是否担心还没准备好使用你那野兽般的区间震荡策略?那么你养家糊口的趋势策略又准备得如何了?
你并不需要觉得害怕!
外汇市场提供了许多趋势和震荡的交易机会,穿插在不同的时间框架之中,
提供了落实这些策略的机会。
通过了解哪些策略是适合哪种趋势后,你会发现以后在选用指标时,自己更容易的从工具箱中挑出适合的指标。
例如,FIBS和趋势线在趋势市场是非常有用的,而枢轴点、支撑和阻力位,则有利于市场在横盘震荡时。
在使用这些指标工具进行交易之前,你必须能够先确定市场的环境。市场的状态,可以被分成三种情况:
● 上升趋势
● 下跌趋势
● 横盘震荡
What is a Trending Market?
A trending market is one in which price is generally moving in one direction.
Sure, price may go against the trend every now and then, but looking at the longer time frames would show that those were just retracements.

Trends are usually noted by “higher highs” and “higher lows” in an uptrend and “lower highs” and “lower lows” in a downtrend.
When trading a trend-based strategy, traders usually pick the major currencies as well as any other currency utilizing the dollar because these pairs tend to trend and be more liquid than other pairs.
Liquidity is important in trend-based strategies. The more liquid a currency pair, the more movement (a. k. a. volatility) we can expect.
Check out Huck’s EUR/USD win from following the trend.
The more movement a currency exhibits, the more opportunities there are for price to move strongly in one direction as opposed to bouncing around within small ranges.
Other than eyeballing price action, you can also make use of technical tools you have learned in previous sections to determine whether a currency pair is trending or not.
ADX in a Trending Market
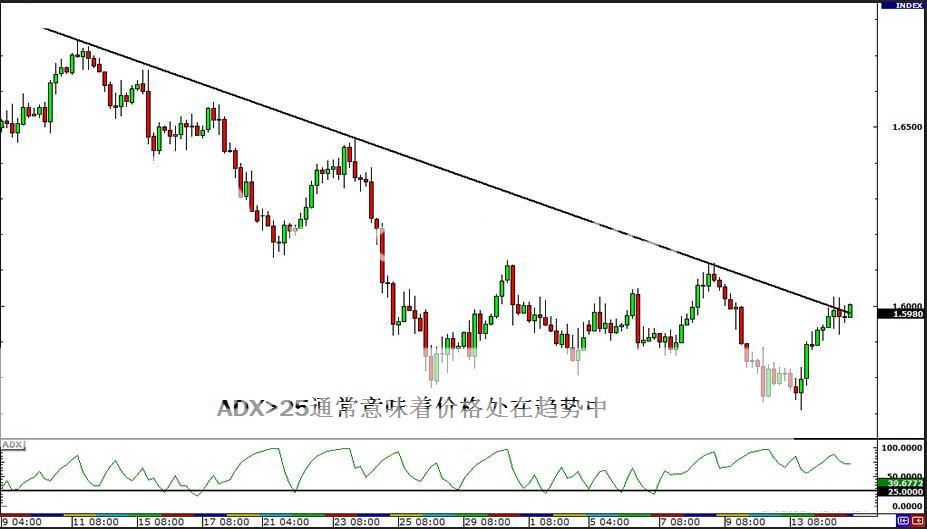
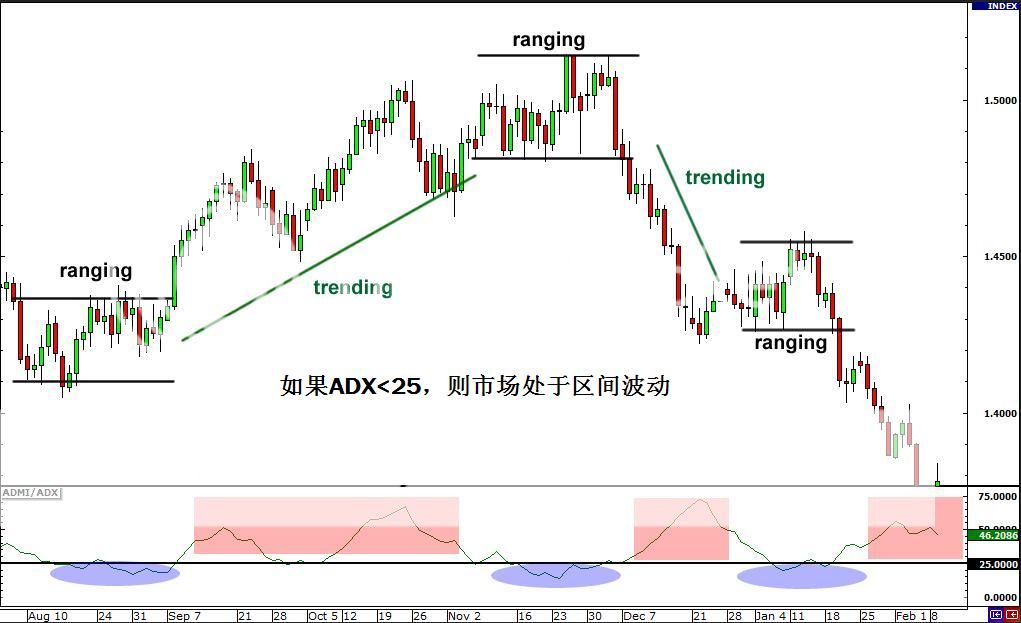
A way to determine if the market is trending is through the use of the Average Directional Index indicator or ADX for short.
Developed by J. Welles Wilder, this indicator uses values ranging from 0-100 to determine if price is moving strongly in one direction, i.e. trending, or simply ranging.
Values more than 25 usually indicate that price is trending or is already in a strong trend.
The higher the number is, the stronger the trend.
However, the ADX is a lagging indicator which means that it doesn’t necessarily predict the future. It also is a non-directional indicator, which means it will report a positive figure whether price is trending up or down.
Take a look at this example. Price is clearly trending downwards even though ADX is greater than 25.

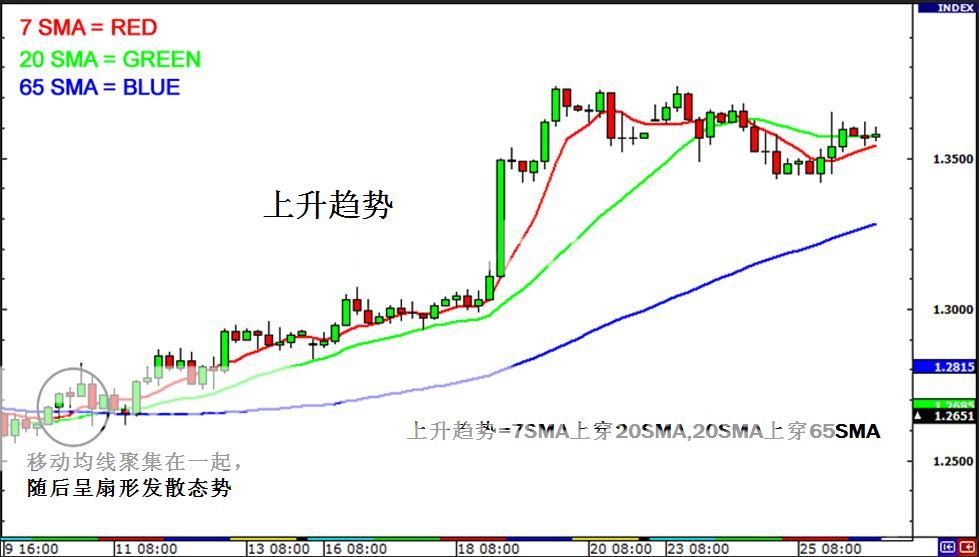
Moving Averages in a Trending Market
If you’re not a fan of the ADX, you can also make use of simple moving averages. Check this out!
Place a 7 period, a 20 period, and a 65 period Simple Moving Average on your chart. Then, wait until the three SMA’s compress together and begin to fan out.
If the 7 period SMA fans out on top of the 20 period SMA, and the 20 SMA on top of the 65 SMA, then price is trending up.

On the other hand, if the 7 period SMA fans out below the 20 period SMA, and the 20 SMA is below the 65 SMA, then price is trending down.

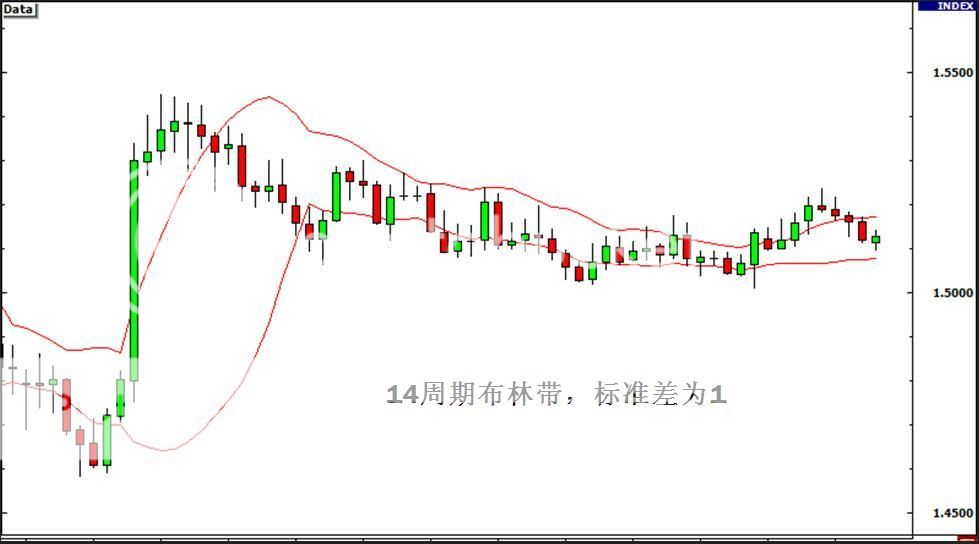
Bollinger Bands in a Trending Market
One tool that is often used for range-bound strategies can also be helpful in trend discovery. We’re talking about Bollinger bands or just Bands.
One thing you should know about trends is that they are actually quite rare. Contrary to what you might think, prices really range 70-80 percent of the time. In other words, it is the norm for price to range.
So, if prices deviate from the “norm” then they must be in a trend right? What is one of the best technical tools we have mentioned in the previous grades that measure deviation?
If you said a ruler, we give you mad props for effort.
If you said Bollinger bands, we’ll give you cyber milk and cookies! Here, take some.

Bollinger bands actually contain the standard deviation formula. But don’t worry about being a nerd and figuring out what that is.
Here’s how we can use Bollinger bands to determine the trend! Prepare for the craziness.
Place Bollinger bands with a standard deviation of 1 and another set of bands with a standard deviation of 2. You will see three set of price zones: the sell zone, the buy zone, and the “No-man’s Land.”

The sell zone is the area between the two bottom bands of the standard deviation 1 (SD 1) and standard deviation 2 (SD 2) bands. Bear in mind that price has to close within the bands in order to be considered in the sell zone.
The buy zone is the area between the two top bands of the SD 1 and SD 2 bands. Like the sell zone, price has to close within the two bands in order to be considered in the buy zone.
The area in between the standard deviation 1 bands is an area in which the market struggles to find direction. Price will close within this area if price is really in “No-Man’s Land”. Price direction is pretty much up for grabs.
The Bollinger bands make it easier to confirm a trend visually.
Downtrends can be confirmed when price is in the sell zone.
Uptrends can be confirmed when price is in the buy zone.
如何确定趋势市场
趋势市场意味着价格通常沿着单一方向波动。
当然,从短时间来说,价格走势可能和趋势整体方向背道而驰,但是,从更长期走势来说,这一走势只是汇价的短期回撤。
上升趋势的典型特征是:高点不断抬高,且低点不断抬高;而下降趋势的典型特征则是:高点不断降低,且低点不断走低。
当进行趋势交易时,交易者们通常会选择主要货币对,以及其他直盘货币对,因为这些货币对趋势明显,且较其他货币对流动性更高。
流动性对趋势交易策略来说非常重要。货币对所具有的流动性越大,我们能够预计的波动性也将越大。波动性越大,货币对朝单一方向运行的势头将越强劲。
除了盯住价格走势外,你也可以借用你在前面课程中所学到的技术工具,来确定某一货币对是否呈现出趋势走势。
ADX指标在趋势市场中的运用
确定市场是否处在趋势运行中的一种方法是使用平均趋向指标(ADX)。
ADX是震荡指标中的一种。它的值介于0-100之间,该指标用来确定价格处在强趋势之中或仅仅只是处在区间震荡中。
指标读书超过25通常意味着价格倾向于或已经出现强趋势走势。
读数越高,趋势越强。不过,ADX指标是一个滞后指标,这意味着该指标并不一定能够预测价格未来走势。该指标也是一个非方向性指标,这意味着不管价格处在上升趋势中还是下降趋势中,该指标都会提供读数为正的数据给我们。
如下图所示,尽管ADX指标读数高于25,但是价格明显处于下降趋势中。
移动均线在趋势市场中的运用
如果你并不是ADX指标的粉丝,你也可以使用简单移动均线。让我们来看看!
我们选择在技术图形中使用7、20、65简单移动均线。等到上述三条简单移动均线聚集在一起,随后呈扇形状散开。
如果7 SMA上破20 SMA,且20 SMA上破65 SMA,那么价格则处在上升趋势中。
布林带在趋势市场中的运用
一种通常用于区间交易策略的工具也能够用来帮助我们发现趋势走势,这一指标就是布林带指标。
关于趋势,有一点你需要明白,这就是趋势实际上相当的稀少。这可能和你想象的有明显出入,事实上,价格在70%-80%的时间内都是处在区间波动中。换句话说,这就是价格维持区间波动的标准。
因此,如果价格偏离了这一“标准”,那么价格一定处在趋势之中。在我们之前所学习的技术工具中,有一种工具能够用来测量这种偏离吗?
如果你说,是直尺,那么,我们得拿尺子在你手心狠狠敲两下。
如果你说是布林带,那么,我们将给你网络版的牛奶和饼干!这里有一些,慢慢享用吧。

布林带是由标准差计算公式计算而来。但是,在这里不要担心自己会成为书呆子,并指出究竟什么是标准差。
现在,我们将介绍如何利用布林带来确定趋势。准备好了吗?
我们在这里选择利用1倍标准差的布林线和2倍标准差的布林线。你将看到这些布林线将价格分成三个区域:卖出区域、买入区域,以及中性区域。
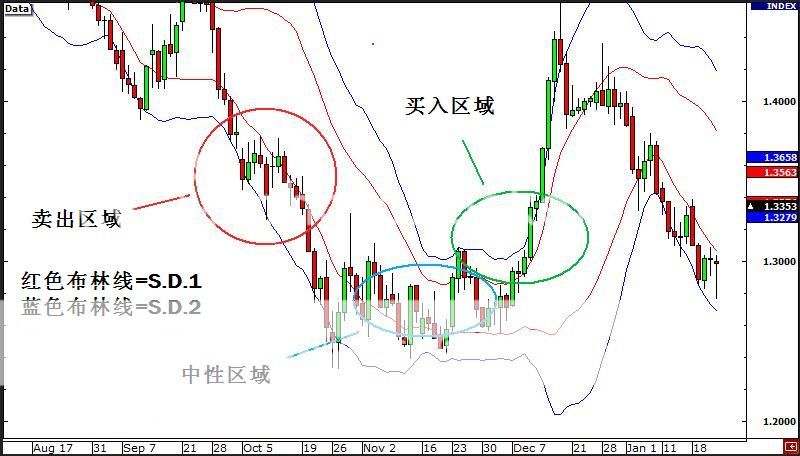
卖出区域介于底部标准差为1和标准差为2的两条布林带之间。市场空头认为,价格必须收于上述两条布林带之间区域,以确定价格处在卖出区域。
买入区域介于顶部标准差为1和标准差为2的两条布林带之间。和卖出区域类似的,价格必须收于上述两条布林带之间区域,以确定价格处在买入区域。
介于标准差为1的两条布林带之间区域被称为中性区域,当价格处在该区域时,说明市场正在极力寻找运行方向。如果价格真的处在中性区域,那么价格将收在该区域内部。
布林带使得我们能够用一种非常直观的方法来确定价格趋势。
当价格处在卖出区域时,我们能够确定下降趋势的到来。
当价格处在买入区域时,我们能够确定上升趋势的到来。
What is a Range-Bound Market?
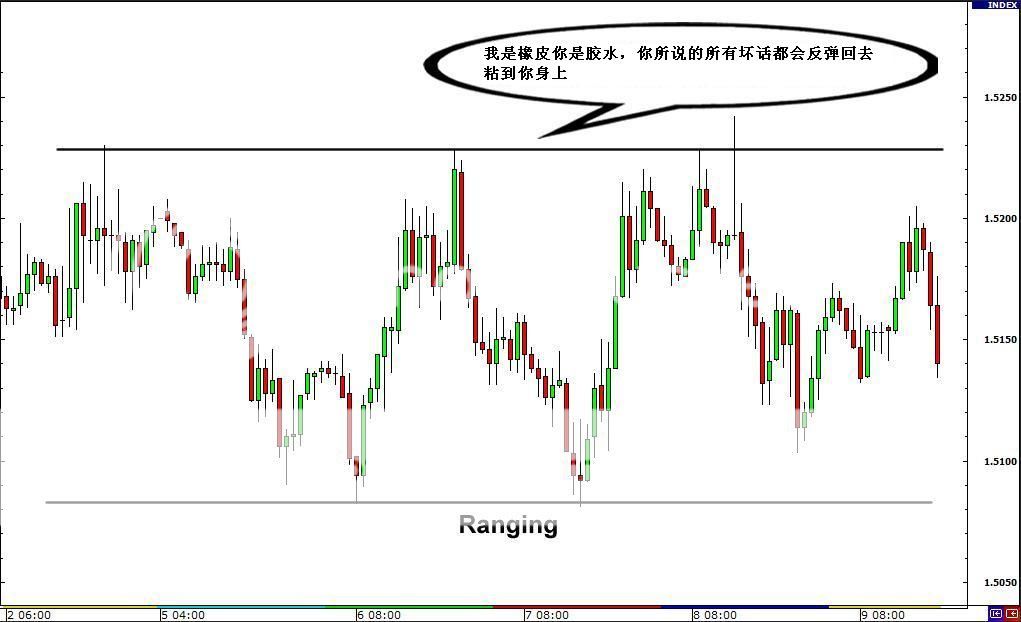
A range-bound market is one in which price bounces in between a specific high price and low price. The high price acts as a major resistance level in which price can’t seem to break through.
Likewise, the low price acts as major support level in which price can’t seem to break as well. Market movement could be classified as horizontal or sideways.

ADX in a Ranging Market
One way to determine if the market is ranging is to use the same ADX that we discussed earlier. A market is said to be ranging when the ADX is below 25. Remember, as the value of the ADX diminishes, the weaker trend is.

Bollinger Bands in a Ranging Market
In essence, Bollinger bands contract when there is less volatility in the market and expand when there is more volatility. Because of that, Bollinger bands provide a good tool for breakout strategies.
When the bands are thin and contracted, volatility is low and there should be little movement of price in one direction. However, when bands start to expand, volatility is increasing and more movement of price in one direction is likely.

Generally, range trading environments will contain somewhat narrow bands compared to wide bands and form horizontally. In this case, we can see that the Bollinger bands are contracted, as price is just moving within a tight range.
The basic idea of a range-bound strategy is that a currency pair has a high and low price that it normally trades between.
By buying near the low price, the forex trader is hoping to take profit around the high price. By selling near the high price, the trader is hoping to take profit around the low price. Popular tools to use are channels such as the one shown above and Bollinger bands.
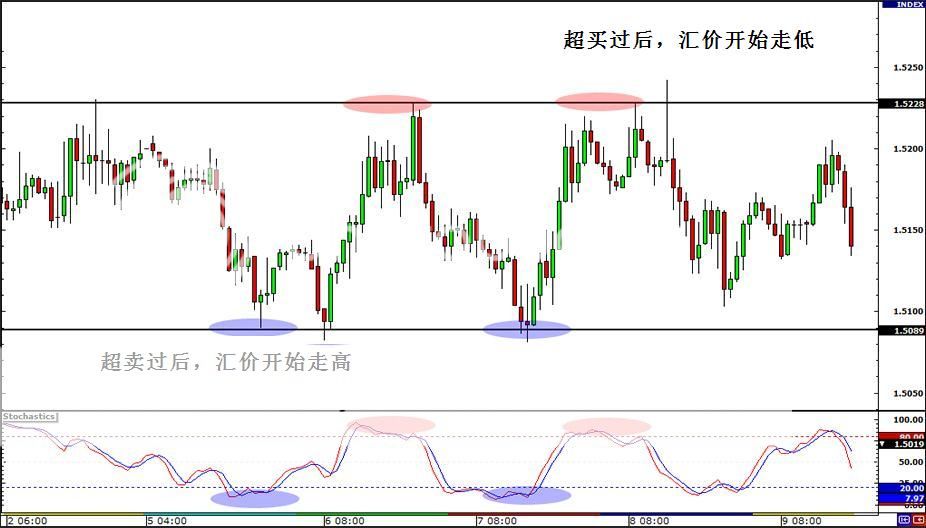
Using oscillators, like Stochastic or RSI, will help increase the odds of you finding a turning point in a range as they can identify potentially oversold and overbought conditions. Here’s an example using GBP/USD.

Bonus tip: The best pairs for trading range-bound strategies are currency crosses. By crosses, we mean those pairs that do not include the USD as one of the currencies in the pair.
One of the most well-known pair for trading ranges is the EUR/CHF. The similar growth rates shared by the European Union and Switzerland pretty much keep the exchange rate of the EUR/CHF stable.
Conclusion
Whether you’re trading a pair that’s in a trending or ranging environment, you should take comfort in knowing that you can profit whatever the case may be.
Find out how you can pick tops and bottoms in both trending and ranging market environments.
By knowing what a trending environment and a ranging environment are and what they look like, you’ll be able to employ a specific strategy for each.
As the old wise man in Central Park says, “Only a fool dips his cookies in habanero salsa!”
区间震荡市场
价格在特定高点和低点之间来回波动的市场称为区间震荡市场。价格高点扮演着主要阻力位角色,价格一般难以突破阻力位压制。
相类似的是,价格低点通常扮演起主要支撑位角色,汇价一般也难以跌破支撑位。市场环境能够分为水平整理或横盘整理。
ADX指标在区间震荡市场中的运用
确定市场是否处于区间震荡中的方法之一是使用ADX指标,ADX指标我们在之前已经向大家介绍过了。当ADX指标维持在25以下时,市场通常处于区间震荡中。记住,ADX读数越低,市场趋势越弱。
布林带在区间震荡市场中的运用
从本质上来说,当市场波动性降低时,布林带呈收缩状态,而当波动性增强时,布林带呈扩张态势。有鉴于此,布林带为进行突破交易策略提供了良好的工具。
当布林带范围较窄且呈收缩态势时,市场波动性较低,且汇价难以出现单边走势。不过,当布林带开口开始扩张,市场波动性增强时,汇价更有可能朝单边波动。
一般来说,在区间交易环境下,布林带范围较窄,且可能形成水平走势。在这一情况下,我们可以看到布林带呈收缩状,因为汇价维持在窄幅区间内波动。
进行区间交易的基本思想是,货币对通常维持在区间高点和低点之间来回波动。
投资者可以在价格低点附近买进,并希望在价格触及区间高点附近时获利;他们也可以选择在价格高点附近卖出,并在价格触及区间低点附近时卖出。受到投资者欢迎的区间交易工具有通道以及布林带。
利用震荡指标,比如随机指标或RSI指标将增强交易者在区间内找到显示价格走势出现转折的反转点的几率,因为震荡指标能够帮助鉴别价格的潜在超买或超卖状况。下图是英镑/美元的例子。
特别建议:最适合进行区间交易的货币对是交叉货币对。在进行区间交易的交叉货币对中,最为我们熟知的是欧元/瑞郎。
结论
不管你是在趋势环境还是区间震荡环境下进行交易,你应该明白的一点是,无论市场环境如何,你都能够获利。
你要做的第一件事是找到市场的顶部和底部,不管是在趋势市场中还是在区间市场中。
知晓了趋势市场以及区间市场到底是什么,以及他们到底是什么样子,你将能够为每一种市场环境下的交易策略选择对应的交易工具。
Retracement or Reversal?
Have you ever been in this situation before?

It looks as though price action may be rallying and a buy trade is in order.
WRONG!

You’ve been hit by the “Smooth Retracement!”
Nobody likes to be hit the “Smooth Retracement” but, sadly, it does happen.
Why?
In the above example, the forex trader failed to recognize the difference between a retracement and a reversal. Instead of being patient and riding the overall downtrend, the trader believed that a reversal was in motion and set a long entry. Whoops, there goes his money!
Check out how Happy Pip got fooled by the “Smooth Retracement” in one of her AUD/USD trades.
In this lesson, you will learn the characteristics of retracements and reversals, how to recognize them, and how to protect yourself from false signals.
What are Retracements?
A retracement is defined as a temporary price movement against the established trend. Another way to look at it is an area of price movement that moves against the trend but returns to continue the trend.

Easy enough? Let’s move on…
What are Reversals?
Reversals are defined as a change in the overall trend of price. When an uptrend switches to a downtrend, a reversal occurs. When a downtrend switches to an uptrend, a reversal also occurs. Using the same example as above, here’s how a reversal looks like.

What Should You Do?
When faced with a possible retracement or reversal, you have three options:
- If in a position, you could hold onto your position. This could lead to losses if the retracement turns out to be a longer term reversal.
- You could close your position and re-enter if the price starts moving with the overall trend again. Of course there could be a missed trade opportunity if price sharply moves on one-direction. Money is also wasted on spreads if you decide to re-enter.
- You could close permanently. This could result in a loss (if price went against you) or a huge profit (if you closed at a top or bottom) depending on the structure of your trade and what happens after.
Because reversals can happen at any time, choosing the best option isn’t always easy. This is why using trailing stop loss points can be a great risk management technique when trading with the trend. You can employ it to protect your profits and make sure that you will always walk away with some pips in the event that a long-term reversal happens.
回撤或反转
你之前经历过类似的情形吗?
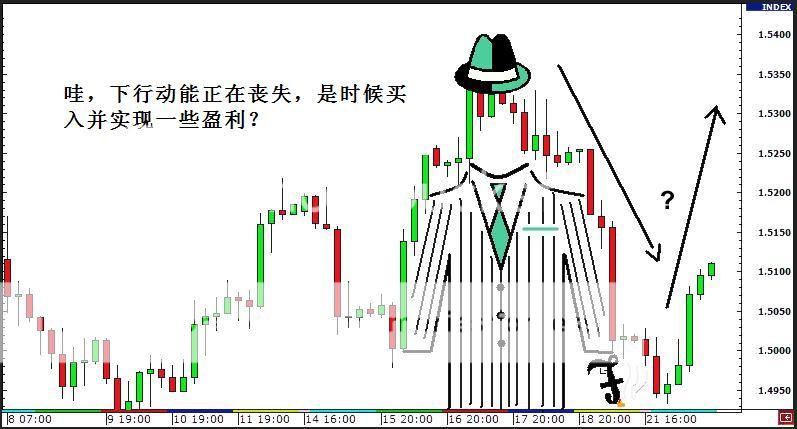
看上去汇价正展开新一轮反弹行情,我们可以选择顺势做多吗?
如果你选择进行上述操作,那么你将大错特错。
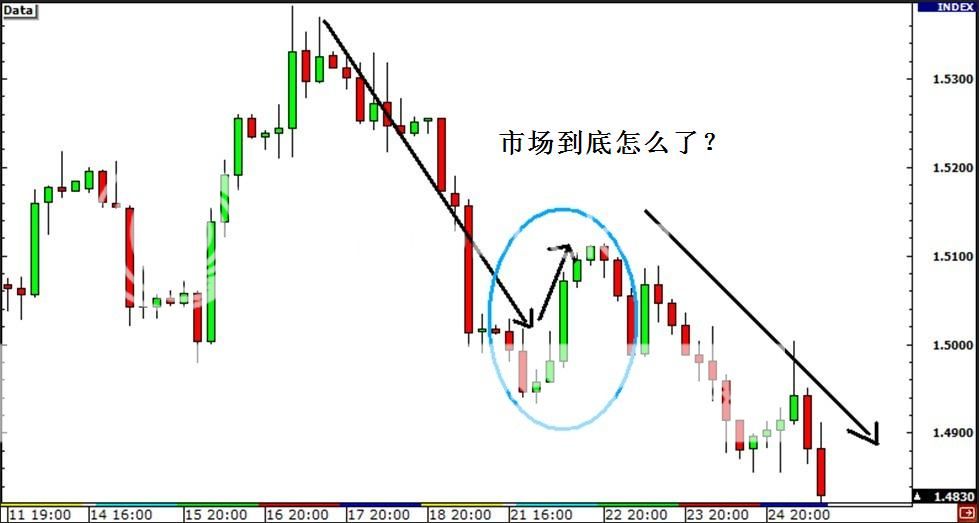
事实证明,这次汇价的回撤让你失血不少。
没人愿意碰到汇价出现回撤的情形,但是不幸的是,它确实经常发生,这是为什么呢?
在上面的例子中,交易者未能区分回撤和反转的区别。交易者并没有保持足够的耐心进而抓住新一轮的下跌行情,而是相信汇价即将出现反转,并多单操作。可惜呀,他的银子也跟随多单一去不复返了。
在本课中,你将学习到回撤和反转的特征,如何认清它们,以及如何保护自己免受虚假信号的伤害。
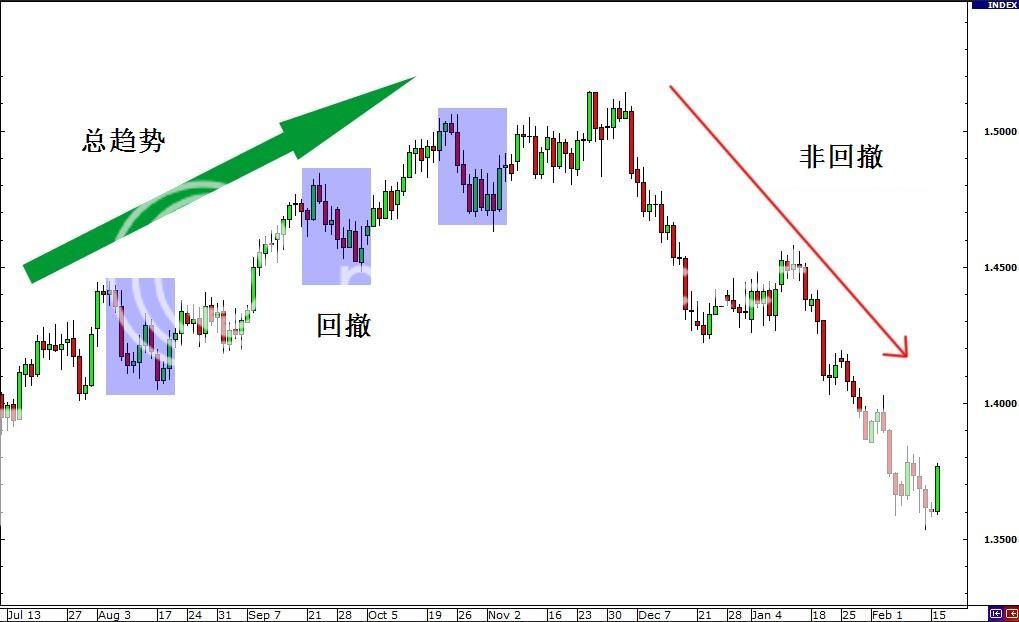
什么是回撤?
回撤的定义是,价格在业已建立起来的趋势运行过程中,出现短暂时间的反向运动。我们也可以将回撤视作价格朝整体运行趋势反向运动的一个区域,在脱离该区域后价格将继续之前的趋势。
很简单,是吗?让我们继续…
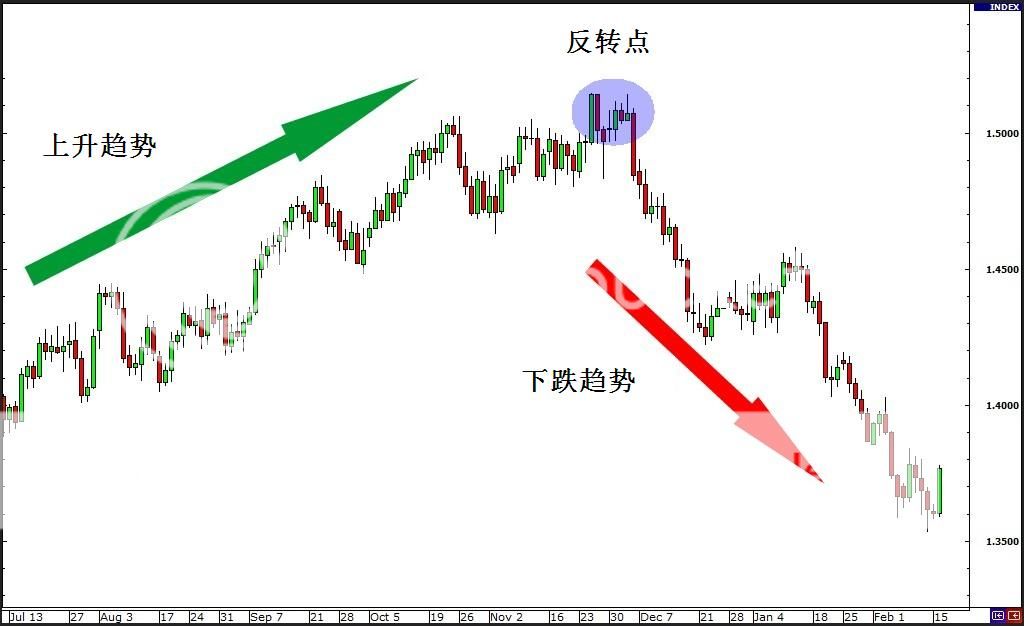
什么是反转
反转的定义是,价格总体趋势的改变。当上升趋势变为下跌趋势,反转便发生了。当下跌趋势变为上升趋势,反转也产生了。我们在这里还是借用上图的例子,不过这次重点描述的是反转的形态。
你应该做什么?
当面对可能的回撤或反转时,你有三种选择:
1. 你可能持有某一货币头寸,当价格的回撤最终被证明是更长期反转走势时,这可能导致你账户的损失。
2. 如果价格开始再次朝着总体趋势运行,你可能选择平仓后再次进入。当然,如果价格快速
朝着单一方向波动,你可能错过交易机会。如果你打算再次入场,你也会损失掉点差费用。
3. 你可能选择永久平仓。如果价格走势和你的单子方向相反,在你平仓后,这可能导致你出现损失;
或者是,如果你在价格接近顶部或底部选择平仓,你也有可能获得巨大利润。
这取决于你的交易结构以及接下来所发生的情况。
因为反转在任何时候都有可能发生,做出做好的选择始终不是那么容易。这也是为什么,当进行趋势交易时,设置移动止损是非常有效的风险管理方法。你能够利用它来保护你的利润,并能够确保,当汇价出现长期反转走势时,你始终能够带着一些获利而离场。
How to Identify Reversals
Properly distinguishing between retracements and reversals can reduce the number of losing trades and even set you up with some winning trades.
Classifying a price movement as a retracement or a reversal is very important. It’s up there with paying taxes *cough*.
There are several key differences in distinguishing a temporary price change retracement from a long-term trend reversal. Here they are:
| Retracements | Reversals |
|---|---|
| Usually occurs after huge price movements. | Can occur at anytime. |
| Short-term, short-lived reversal. | Long-term price movement |
| Fundamentals (i.e., the macroeconomic environment) don’t change. | Fundamentals DO change, which is usually the catalyst for the long-term reversal. |
| In an uptrend, buying interest is present, making it likely for price to rally. In a downtrend, selling interest is present, making it likely for price to decline. | In an uptrend, there is very little buying interest forcing the price to fall lower. In a downtrend, there is very little selling interest forcing the price to rise further. |
Identifying Retracements
A popular way to identify retracements is to use Fibonacci levels.
For the most part, price retracements hang around the 38.2%, 50.0% and 61.8% Fibonacci retracement levels before continuing the overall trend.
If price goes beyond these levels, it may signal that a reversal is happening. Notice how we didn’t say will. As you may have figured out by now, technical analysis isn’t an exact science, which means nothing certain… especially in forex markets.

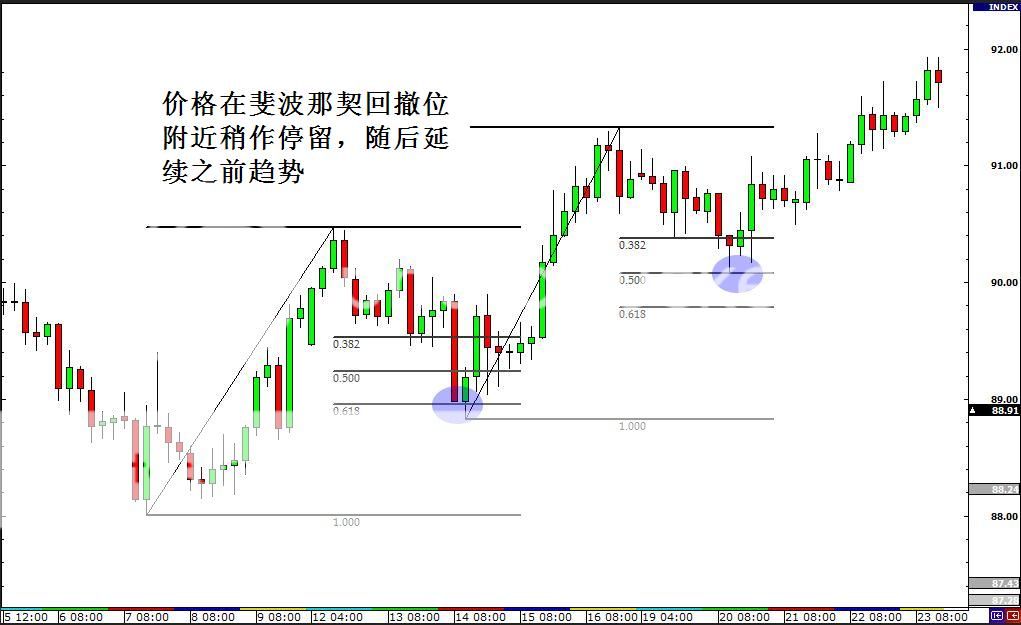
In this case, price took a breather and rested at the 61.8% Fibonacci retracement level before resuming the uptrend. After a while, it pulled back again and settled at the 50% retracement level before heading higher.
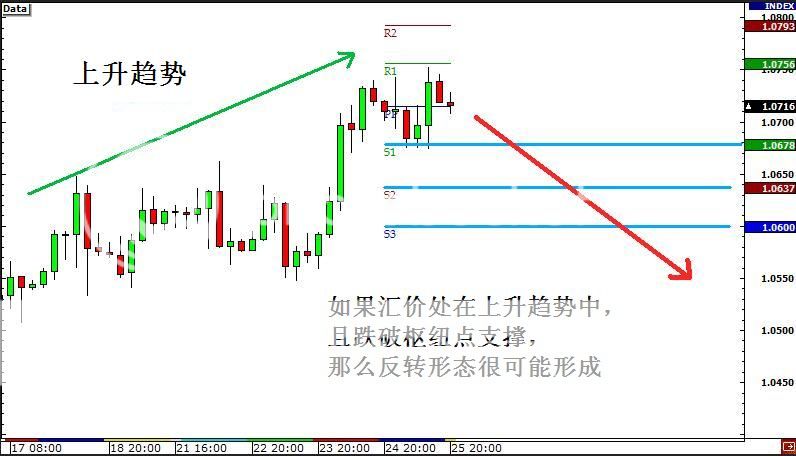
Another way to see if price is staging a reversal is to use pivot points.
In an uptrend, traders will look at the lower support points (S1, S2, S3) and wait for it to break. In a downtrend, forex traders will look at the higher resistance points (R1, R2, R3) and wait for it to break.
If broken, a reversal could be in the making! For more information or another refresher, check out the Pivot Points Lesson!

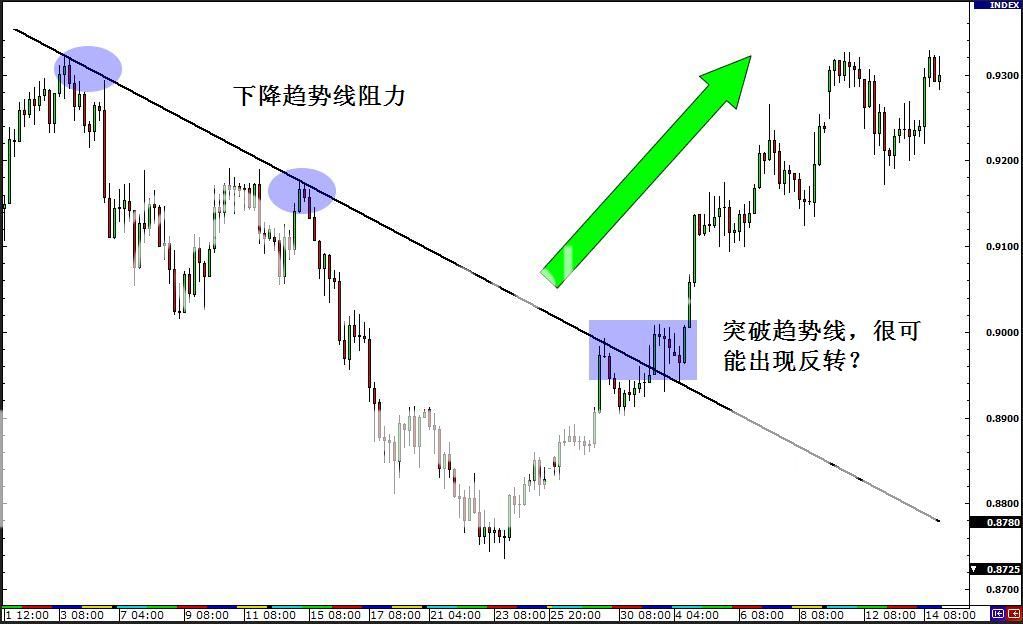
The last method is to use trend lines. When a major trend line is broken, a reversal may be in effect.
By using this technical tool in conjunction with candlestick chart patterns discussed earlier, a forex trader may be able to get a high probability of a reversal.

While these methods can identify reversals, they aren’t the only way. At the end of the day, nothing can substitute for practice and experience.
With enough screen time, you can find a method that suits your forex trading personality in identifying retracements and reversals.
反转的识别
对回撤和反转进行恰当的区分能够降低我们的交易损失,甚至可以扩大我们的交易胜算率。
区分价格走势是回撤或是反转非常重要。
价格的短暂回撤和长期趋势反转之间有一些非常关键的区别,以下便是:
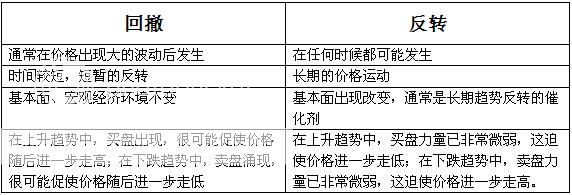
回撤的鉴别
鉴别回撤的最常见方法就是使用斐波那契工具。
在大多数情况下,价格在延续总体趋势之前,其回撤过程通常会在前期趋势的38.2%、50.5%、61.8%斐波那契回撤位水平附近遇到阻碍。
如果价格穿越上述水平位,则很可能预示着反转形态的发生。注意了,我们在这里并没有用“将要”。你现在应该知道我们在这里要强调的重点了,是的,技术分析并非是精确的科学计算,这意味着什么都没有绝对的事情,尤其在外汇市场中。
鉴别价格是否出现反转的另一方法是使用枢纽点。
在上升趋势中,交易者将观察枢纽点支撑位(S1、S2、S3)并等待价格跌破上述价位。在下跌趋势中,交易者会观察枢纽点阻力位(R1、R2、R3)并等待价格突破上述价位。
如果价格跌破支撑位或突破阻力位,则意味着反转可能发生。如果你想要了解或是温习一下有关枢纽点的内容,请回到我们之前所讲授过的有关枢纽点课程。
最后一种方法是使用趋势线。当某一主要趋势线被突破时,则反转有可能出现。
将这一技术工具和我们之前讲过的蜡烛形态结合起来运用,交易者能够获得识别反转形态的高胜算。
尽管上述方法能够帮助我们鉴别反转形态,但掌握了这些技巧就断言能够有效的识别反转还为时过早,因为无论什么方法,都无法取代耐心和经验。
随着时间的积累,你将能够找到一种合适你自己的个人交易方法,来准确识别价格的反转以及回撤。
Protect YourSelf From Reversals
Whenever Happy Pip goes swimming at the beach or the pool, she always wears her hot pink rubber ducky floaters. Whenever she trades retracements, she uses stop loss points.
Pink rubber ducky floaters are life savers. Stop loss points are capital savers.

As we said before, reversals can happen at any time. Retracements can turn into reversals without warning.
This makes using trailing stops in trending markets very important. With trailing stop loss points, you can effectively prevent yourself from exiting a position too early during a retracement and exit a reversal in a pinch.
Conclusion
You don’t have to be shot down by the “Smooth Retracement”. You don’t have to lose all those pips. And you most certainly don’t need to wear pink arm floaties (although if pink’s your favorite color, it’s okay – we don’t judge).
Just know how to distinguish retracements from reversals. This is part of growing up as a trader. Having the ability to do so will effectively reduce your losses and prevent winners from turning into losers.
With lots of practice and experience, you’ll find yourself being able to trade accordingly to retracements and exit with a profit more times than not.
May we also suggest further reading for this topic? These forum threads might be able to help you out:
在反转中保护自己
每当我们的朋友Happy Pip去游泳池或海滩游泳时,她总是带着自己艳丽的粉红色鸭子游泳圈。 而当她要在进行回撤交易时,她总是使用止损点。
粉红色的鸭子游泳圈,是生命的救星。而止损点是 资本的救星。

正如我们之前说过的,反转可以发生在任何时候。回调可以在没有任何警告的情况下,变成反转。
在趋势的环境中使用追踪止损,是非常重要的。使用追踪止损,你可以有效地避免自己在价格只是回调时,太早的出场。并在价格反转时,及时的出场。
结论
您没有必要,被“平稳的回调”所击倒。你也没有必要,亏完所有获利的点。只因为你没有穿上粉红色的救生圈(尽管粉红色可能是你最喜欢的颜色,至于适不适于你 – 我们不予置评)。
要掌握如何从反转中,分辨出哪些是回调。这是交易者成长的其中一部分。具备这样的能力可以有效的减少你的亏失,并避免从赢家沦落为输家。
随着一段时间的实践,和经验累积。你会发现自己,能够根据市场回调进行相应的交易,并在大多数的时候,带着盈利出场。