Support & Resistance
Support and resistance is one of the most widely used concepts in forex trading. Strangely enough, everyone seems to have their own idea on how you should measure forex support and resistance.
Let’s take a look at the basics first.

Look at the diagram above. As you can see, this zigzag pattern is making its way up (bull market). When the forex market moves up and then pulls back, the highest point reached before it pulled back is now resistance.
As the market continues up again, the lowest point reached before it started back is now support. In this way, resistance and support are continually formed as the forex market oscillates over time. The reverse is true for the downtrend.
Plotting Forex Support and Resistance
One thing to remember is that support and resistance levels are not exact numbers.
Often times you will see a support or resistance level that appears broken, but soon after find out that the market was just testing it. With candlestick charts, these “tests” of support and resistance are usually represented by the candlestick shadows.

Notice how the shadows of the candles tested the 1.4700 support level. At those times it seemed like the market was “breaking” support. In hindsight we can see that the market was merely testing that level.
So how do we truly know if support and resistance was broken?
There is no definite answer to this question. Some argue that a support or resistance level is broken if the market can actually close past that level. However, you will find that this is not always the case.
Let’s take our same example from above and see what happened when the price actually closed past the 1.4700 support level.

In this case, price had closed below the 1.4700 support level but ended up rising back up above it.
If you had believed that this was a real breakout and sold this pair, you would’ve been seriously hurtin’!
Looking at the chart now, you can visually see and come to the conclusion that the support was not actually broken; it is still very much intact and now even stronger.
To help you filter out these false breakouts, you should think of support and resistance more of as “zones” rather than concrete numbers.
One way to help you find these zones is to plot support and resistance on a line chart rather than a candlestick chart. The reason is that line charts only show you the closing price while candlesticks add the extreme highs and lows to the picture.
These highs and lows can be misleading because often times they are just the “knee-jerk” reactions of the market. It’s like when someone is doing something really strange, but when asked about it, he or she simply replies, “Sorry, it’s just a reflex.”
When plotting support and resistance, you don’t want the reflexes of the market. You only want to plot its intentional movements.
Looking at the line chart, you want to plot your support and resistance lines around areas where you can see the price forming several peaks or valleys.

Other interesting tidbits about forex support and resistance:
- When the price passes through resistance, that resistance could potentially become support.
- The more often price tests a level of resistance or support without breaking it, the stronger the area of resistance or support is.
- When a support or resistance level breaks, the strength of the follow-through move depends on how strongly the broken support or resistance had been holding.

With a little practice, you’ll be able to spot potential forex support and resistance areas easily. In the next lesson, we’ll teach you how to trade diagonal support and resistance lines, otherwise known as forex trend lines.
支撑和阻力
“支撑与阻力”是交易中运用最广的概念之一。很奇怪的是,关于怎样决定“支撑和阻力”的问题,每个人似乎都有自己的想法。
首先看一下基础知识。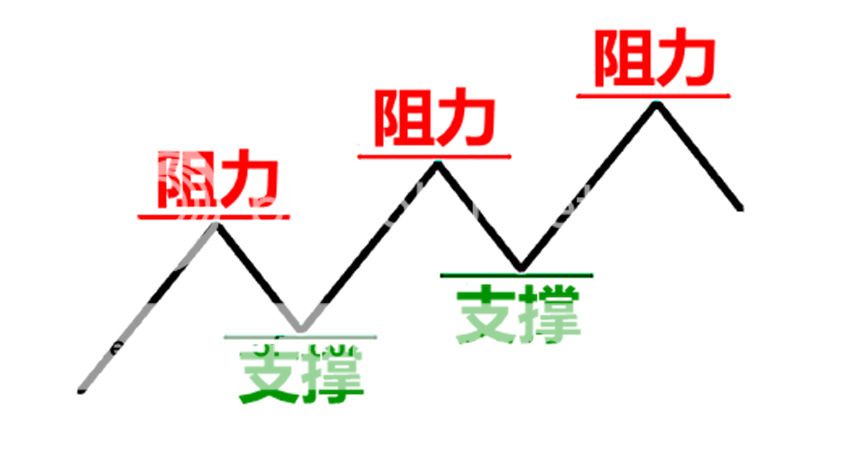
正如你从图中所见,这个“之”字型的图构成了上升市场(牛市)。当市场上升然后回落的时候,在它回落之前所达到的最高点就是目前的阻力。
随着市场的不断回升,在市场开始上升之前所达到的最低点就是目前的支撑。这样,阻力和支撑就是随着市场经过一段时间的振荡而不断形成的。
画出的支撑和阻力
有一点要记住的是,支撑和阻力水平 是不准确的数字 。
你经常会看到支撑或阻力位出现突破,但是不久后就发现这只是市场在测试它。这些支撑和阻力的“测试”通常由蜡烛的影线部分来表示。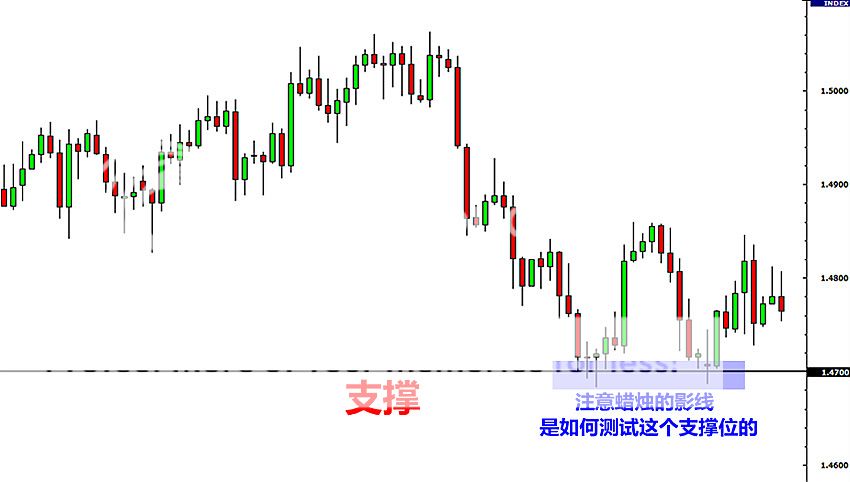
注意蜡烛的影线是如何测试了1.4700这个支撑水平的。在那段时间,好像是市场在“打破”支撑位,但是事后回想起来,我们明白那只是市场在进行位置测试。
所以,我们该如何辨认支撑和阻力是否被打破呢?
对于这个问题,没有明确的答案。有人认为, 如果价格的收盘价能完全突破以前的位置,那么就打破了支撑和阻力位。然而,你会发现事实并非总是如此。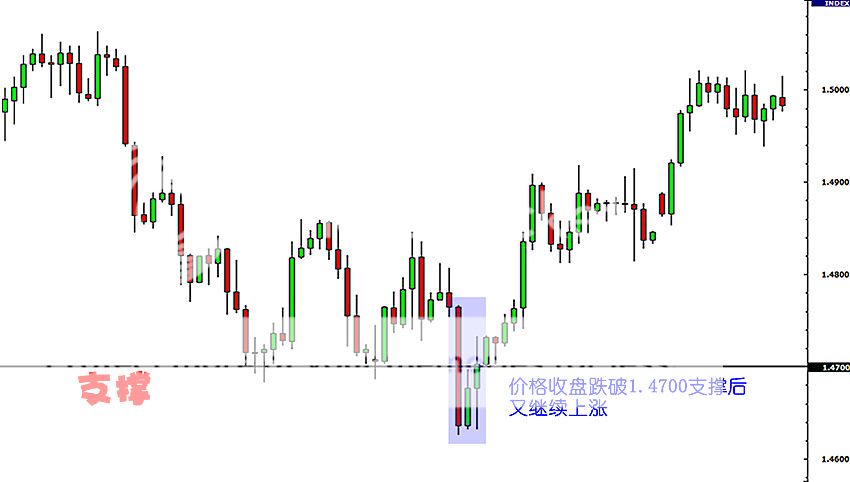
我们从上面的例子看到,当价格的收盘价在跌破之前的1.4700的支撑位的时候,发生了什么事呢?在这种情况下,价格都在跌破 1.4700支撑位后收盘,但是又升破1.4700的支撑位继续上升了。
如果你曾认为这是个真正的突破并且出售了该货币对,那么你就亏大了。
现在看一下图表,你可以得出结论:支撑没有真正被打破,它一直很完整,现在甚至更强劲了。当你学会辨认这些假突破,您应该会将支撑和阻力考虑为一个“区域”,而不是具体的数字。
有一种方法可以帮助你找到这些区域,就是在折线图画出支撑和阻力,而不是在烛柱图。原因是折线图只显示你的收盘价,而灯柱图在这幅图上增加了开盘价、最高价和最低价。
尤其是最高价和最低价可能会误导你们,因为它们通常只是市场的“自然”反应。这就像当有人做一些真正古怪的事,当人们问他的时候,他或她只是简单的回答说:“对不起,它只是一个习惯的自然反应。”
当标示支撑和阻力位的时候,你不会想要在乎市场的自然反应,你只想画出它的真正趋势。
看看这个折线图,你会在因价格形成的几个尖峰和低谷的区域周围画出支撑和阻力线。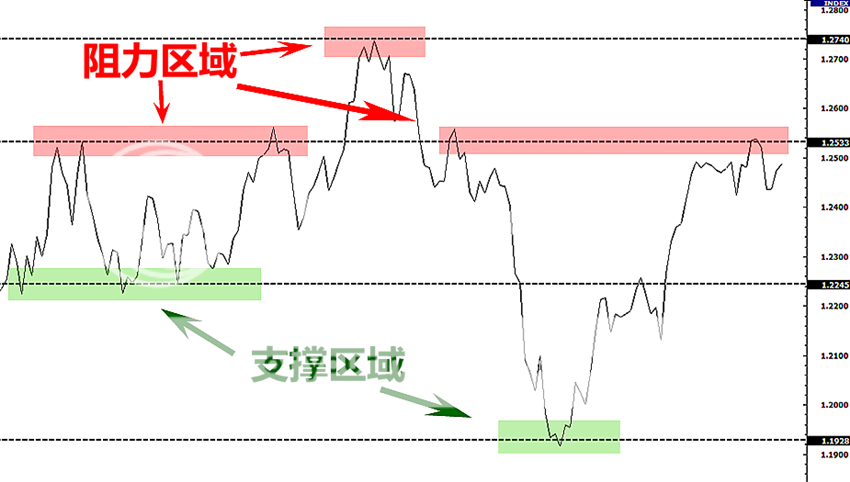
其他有关支撑和阻力的要点
• 价格经过阻力的时候,阻力可能成为支撑。
• 价格越是在多次测试它的情况下没有突破位置,该阻力和支撑的区域就越强。
• 当一个强劲的支撑和阻力位确认被突破的时候,就会反转为强劲的阻力和支撑位。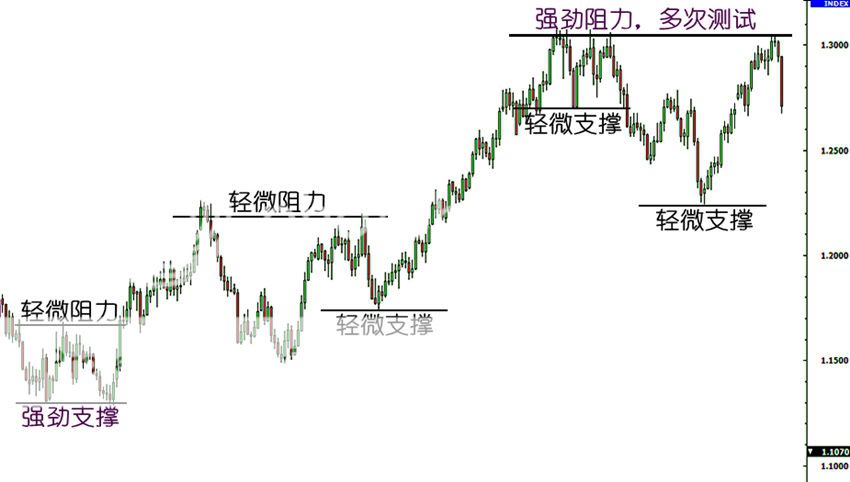
经过一定的练习,你就能很容易发现潜在的支撑和阻力区域,。在接下来的课程中,我们将教你如何用对角支撑和阻力线做交易,或者叫做趋势线。 Trend Lines
Trend lines are probably the most common form of technical analysis in forex trading. They are probably one of the most underutilized ones as well.
If drawn correctly, they can be as accurate as any other method. Unfortunately, most forex traders don’t draw them correctly or try to make the line fit the market instead of the other way around.
In their most basic form, an uptrend line is drawn along the bottom of easily identifiable support areas (valleys). In a downtrend, the trend line is drawn along the top of easily identifiable resistance areas (peaks).
How do you draw forex trend lines?
To draw forex trend lines properly, all you have to do is locate two major tops or bottoms and connect them.
What’s next?
Nothing.
Uhh, is that it?
Yep, it’s that simple.
Here are trend lines in action! Look at those waves!

Types of Trends
There are three types of trends:
- Uptrend (higher lows)
- Downtrend (lower highs)
- Sideways trends (ranging)
Here are some important things to remember using trend lines in forex trading:
- It takes at least two tops or bottoms to draw a valid trend line but it takes THREE to confirm a trend line.
- The STEEPER the trend line you draw, the less reliable it is going to be and the more likely it will break.
- Like horizontal support and resistance levels, trend lines become stronger the more times they are tested.
- And most importantly, DO NOT EVER draw trend lines by forcing them to fit the market. If they do not fit right, then that trend line isn’t a valid one!
趋势线
趋势线可能是技术分析中最常使用的技术,它也可能是最没有得到充分使用的技术。
如果正确地画出,它们就可以和其他技术一样准确。可惜的是,大部分的交易者不懂得正确地画出趋势线或是反过来企图让趋势线来配合市场的走向。
在趋势线最基本的画法中,上升趋势线沿着容易辨认的底部(山古)画出支撑线。在下跌趋势中,趋势线沿着容易辨认的顶部(山峰)画出阻力线。
怎样绘制趋势线?
要正确绘制趋势线,你所要做的就是找到两个主要的顶部或底部,并把它们连接起来。
然后下一步是什么呢? 没有了咯
额,就这样? 是的,就是这么简单呗。
以下就是实际操作中的趋势线!看看这些波浪!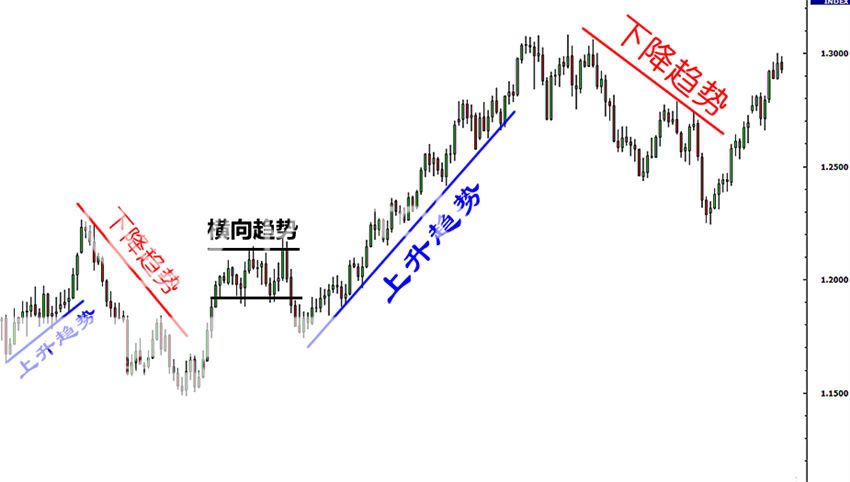
趋势的类型
三种类型的趋势线
1. 上升趋势(逐渐上升的低点)
2. 下跌趋势(逐渐下降的高点)
3. 横向趋势(震荡)
以下是一些关于趋势线应该记住的重要事情:
至少需要有两个顶部或底部才能画出趋势线,但它需要第三个点来确认趋势线的有效。
在画出的趋势线中,角度越是陡峭的越不可靠,它越有可能被突破。
正如支撑和阻力位一样,测试次数越多的趋势线,越强劲。
更重要的是,永远都不要 企图强逼让趋势线来配合市场的走向,不合适的趋势线是不会有效。 Channels
If we take this trend line theory one step further and draw a parallel line at the same angle of the uptrend or downtrend, we will have created a channel. No, we’re not talking about ESPN, ABC, or Cartoon Network.
Still, this doesn’t mean that you should walk away like it’s a commercial break- channels can be just as exciting to watch as America’s Next Top Model or Entourage!
Channels are just another tool in technical analysis which can be used to determine good places to buy or sell. Both the tops and bottoms of channels represent potential areas of support or resistance.

To create an up (ascending) channel, simply draw a parallel line at the same angle as an uptrend line and then move that line to position where it touches the most recent peak. This should be done at the same time you create the trend line.
To create a down (descending) channel, simply draw a parallel line at the same angle as the downtrend line and then move that line to a position where it touches the most recent valley. This should be done at the same time you create the trend line.
When prices hit the bottom trend line, this may be used as a buying area. When prices hit the upper trend line, this may be used as a selling area.
Types of channels
There are three types of channels:
- Ascending channel (higher highs and higher lows)
- Descending channel (lower highs and lower lows)
- Horizontal channel (ranging)
Important things to remember about drawing trend lines:
- When constructing a channel, both trend lines must be parallel to each other.
- Generally, the bottom of channel is considered a buy zone while the top of channel is considered a sell zone.
- Like in drawing trend lines, DO NOT EVER force the price to the channels that you draw! A channel boundary that is sloping at one angle while the corresponding channel boundary is sloping at another is not correct and could lead to bad trades.
通道
如果我们在这个趋势线的理论再进一步,在相同角度的趋势线上画出另一条平行线,我们就就会创出一个通道。当然,我们不是在谈论“电线、铁路,或是什么门路通道”
尽管如此,这并不意味着你得好像看到广告新闻一样的走开一下——通道其实也像中国达人秀或刘谦的魔术般让人兴奋!
通道只是技术分析中,一种用来确定买卖拐点位置的工具。通道的顶部和底部都代表潜在的支撑或阻力位置。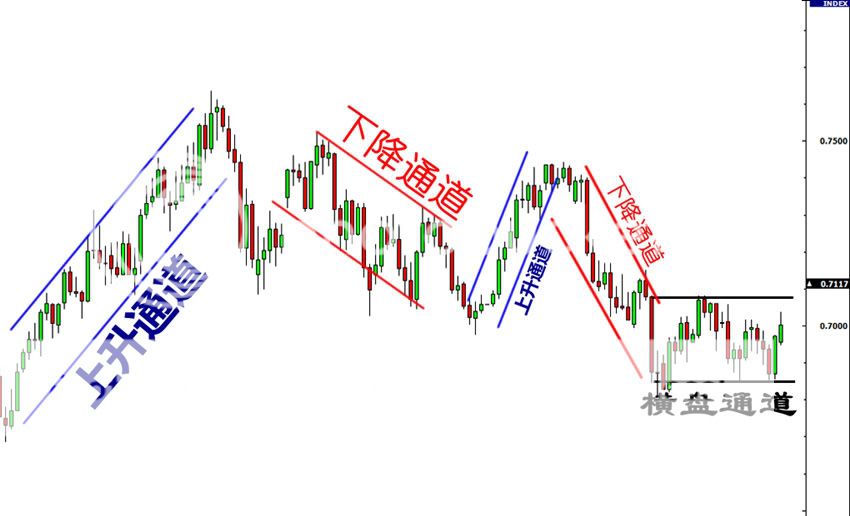
要构建一个向上的通道,只需要在上升趋势线的相同角度画出另一条平行线,然后移动这条线,使它触到最近的顶部。这项工作应该在画趋势线时同时完成 。
要构建一个向下的通道,只需要在下降趋势线的相同角度画出另一条平行线,然后移动这条线,使它触到最近的底部。这项工作应该在画趋势线时同时完成
。
当价格到达底部的趋势线的时候,这可以作为买入位置使用。
当价钱到达较高的趋势线的时候,这可以作为卖出位置使用。
通道的类型
渠道的三种类型
1. 上升通道(逐渐上升的高点和低点 )
2. 下降通道(逐渐下降的高点和低点 )
3. 横盘通道(震荡)
关于趋势线得记住的重要事情:
• 建造一个通道的时候,两条趋势线必须是平行的。
• 通常,通道的底部是做多区域,而其顶部是做空区域。
像画趋势线一样,永远不要 企图强逼把价格硬塞进你所画的通道里。如果通道的两条线不平行的话,那是错误的,可能导致失败的交易。 How to Trade Support and Resistances
Now that you know the basics, it’s time to apply these basic but extremely useful technical tools in your trading. Because here at BabyPips.com we want to make things easy to understand, we have divided how to trade support and resistance levels into two simple ideas: the Bounce and the Break.
The Bounce

As the name suggests, one method of trading support and resistance levels is right after the bounce.
Many retail forex traders make the error of setting their orders directly on support and resistance levels and then just waiting to for their trade to materialize. Sure, this may work at times but this kind of trading method assumes that a support or resistance level will hold without price actually getting there yet.
You might be thinking, “Why don’t I just set an entry order right on the line? That way, I am assured the best possible price.”
When playing the bounce, we want to tilt the odds in our favor and find some sort of confirmation that the support or resistance will hold.
Instead of simply buying or selling right off the bat, wait for it to bounce first before entering. By doing this, you avoid those moments where price moves fast and break through support and resistance levels. From experience, catching a falling knife when trading forex can get really bloody…


The Break
In a perfect world, support and resistance levels would hold forever, McDonald’s would be healthy, and we’d all have jetpacks. In a perfect forex trading world, we could just jump in and out whenever price hits those major support and resistance levels and earn loads of money. The fact of the matter is that these levels break… often.
So, it’s not enough to just play bounces. You should also know what to do whenever support and resistance levels give way!
There are two ways to play breaks in forex trading: the aggressive way or the conservative way.
The Aggressive Way
The simplest way to play breakouts is to buy or sell whenever price passes convincingly through a support or resistance zone. The key word here is convincingly because we only want to enter when price passes through a significant support or resistance level with ease.
We want the support or resistance area to act as if it just received a Chuck Norris karate chop: We want it to wilt over in pain as price breaks right through it.

The Conservative Way
Imagine this hypothetical situation: you decided to go long EUR/USD hoping it would rise after bouncing from a support level. Soon after, support breaks and you are now holding on to a losing position, with your account balance slowly falling.
Do you…
A. Accept defeat, get the heck out, and liquidate your position?
or
B. Hold on to your trade and hope price rises up again?
If your choice is the second one, then you will easily understand this type of forex trading method. Remember, whenever you close out a position, you take the opposite side of the trade. Closing your EUR/USD long trade at or near breakeven means you will have to short the EUR/USD by the same amount.
Now, if enough selling and liquidation of losing positions happens at the broken support level, price will reverse and start falling again. This phenomenon is the main reason why broken support levels become resistance whenever they break.
As you would’ve guessed, taking advantage of this phenomenon is all about being patient. Instead of entering right on the break, you wait for price to make a “pullback” to the broken support or resistance level and enter after the price bounces.

Whoops, sorry about that folks, the caps lock key got stuck.
如何使用阻力和支撑来交易
既然你了解了基础知识,也是时候在交易中运用这些基本但非常有用的技术工具了。因为在Babypips这里,我们希望一切的知识都很容易理解,所以我们把交易支撑和阻力位分成两个简单的策略:反弹和突破。
反弹策略
 顾名思义,使用支撑和阻力位的一种方法就是在反弹之后。
许多散户交易者错误地将订单直接挂在支持和阻力位上,然后就一直等着他们的订单兑现。当然,这种方法有时可能很有效,但是这种交易的方法是假定在,价格到达支撑位和阻力位那里的情况下,价格就会反弹。
你可能会想:“我当然把订单直接挂在支持和阻力位上啦?这样一来,我可以赚得最大的利润。”
当我们在操作反弹交易的时候,我们需要辨识出对我们有利的胜算,并且找出有把握的支撑和阻力位。然后在它第一次反弹时才简单直接的下单,这样做的话,可避免大波动时,价格迅速突破支撑与阻力位。经验告诉我们,想接住一把快速飞来的刀子容易发生流血的事件。。。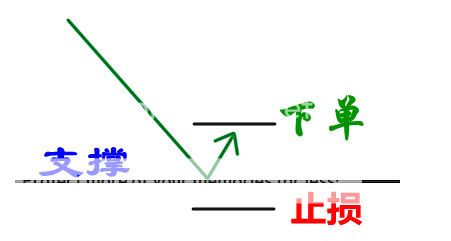
突破策略
在理想的世界里,支撑和阻力位会永远不变,多吃麦当劳会有益于身体健康,每个人都会支竹蜻蜓。在理想的交易世界里,我们只要在价格到达主要的支撑位和阻力位时,轻松的买进卖出就可以赚很多钱很多的钱。但现实是这些支撑和阻力位都被突破。。。而且还经常被突破。
所以,仅仅学会反弹策略是不足够的。,你也应该知道当支撑和阻力位被突破后要做什么!突破后的交易方式有两种:激进方式和保守方式。
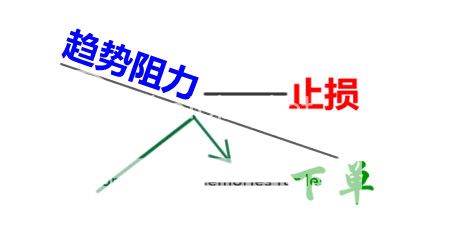
激进方式
突破后最简单的交易策略就是当价格强劲有力的突破支撑和阻力位的时候进行下单。这里的关键字眼是“强劲有力的”,因为我们只需要在价格通过一个重要的支撑和阻力位的时候就轻松的下单。
我们希望见到支撑或阻力区域,就像挨到李小龙《猛龙过江》电影中的空手道高手Chuck Norris的劈掌效果一样:我们想要看支撑或阻力位随着价格的突破,而在痛苦中衰弱。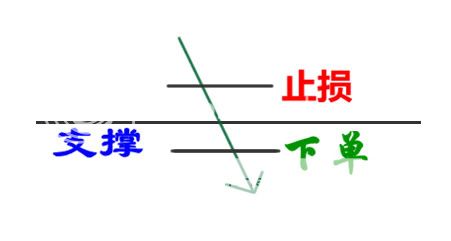
保守方式
设想一下这个假设性的情境: 你决定做多 欧元/美元,原本希望它从支撑位反弹后继续上涨。但突然间支撑位被突破,而且你账户的余额正逐步减少的时候
你会。。。
1. 接受失败,立刻平仓?
2. 坚持持单并且希望价格上涨?
如果你选择第二种,那么你会很容易地明白这种交易方法。记住,当你在平仓的时候,你就是在做反向的交易。要平掉你的欧元/美元的多头交易,就意味着你必须以同样的数目的头寸做空欧元/美元。现在,如果有足够的空单和止损单,在价格突破支撑位的附近时,价格将会回撤,然后才继续下跌。这一现象也是为什么,突破后的支撑位会转为阻力位,的主要原因。
正如您所猜到的一样,利用这种现象的都是有耐心的人。和激进下单的方式相反,这种方式要等待“回调”的价格,达到突破的支撑或阻力位附近,并且在价格反弹时进入。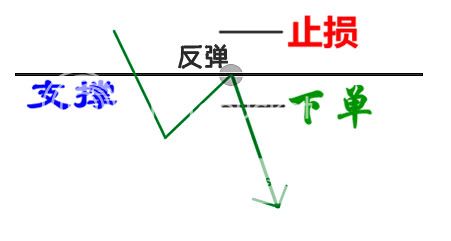
几句忠告:这种事情不会时常发生。突破支撑和阻力位的“重复测试”不会总是发生。有时候, 价格只往一个方向移动,并且把你抛之脑后。因为这样,所以总是采用止损交易而且永远不要只是因为希望而不止损。
哎呦,”红色键” 卡住了,我们对此深感抱歉。
Summary of Trading Support & Resistance

When the market moves up and then pulls back, the highest point reached before it pulls back is now resistance.
As the market continues up again, the lowest point reached before it climbs back is now support.
One thing to remember is that horizontal support and resistance levels are not exact numbers.
To help you filter out these false breakouts, you should think of support and resistance more of as “zones” rather than concrete numbers.
One way to help you find these zones is to plot support and resistance on a line chart rather than a candlestick chart.
Another thing to remember is that when price passes through a resistance level, that resistance could potentially become support. The same could also happen with a support level. If a support level is broken, it could potentially become a resistance level
Trend Lines
In their most basic form, an uptrend line is drawn along the bottom of easily identifiable support areas (valleys). In a downtrend, the trend line is drawn along the top of easily identifiable resistance areas (peaks).
There are three types of trends:
- Uptrend (higher lows)
- Downtrend (lower highs)
- Sideways trends (ranging)
Channels
To create an up (ascending) channel, simply draw a parallel line at the same angle as an uptrend line and then move that line to position where it touches the most recent peak.
To create a down (descending) channel, simple draw a parallel line at the same angle as the downtrend line and then move that line to a position where it touches the most recent valley.
- Ascending channel (higher highs and higher lows)
- Descending channel (lower highers and lower lows)
- Horizontal channel (ranging)
Trading support and resistance levels can be divided into two methods: the bounce and the break.
When trading the bounce we want to tilt the odds in our favor and find some sort of confirmation that the support or resistance will hold. Instead of simply buying or selling right off the bat, wait for it to bounce first before entering. By doing this, you avoid those moments where price moves so fast that it slices through support and resistance levels like a knife slicing through warm butter.
As for trading the break, there is the aggressive way and there is the conservative way. In the aggressive way, you simply buy or sell whenever the price passes through a support or resistance zone with ease. In the conservative way, you wait for price to make a “pullback” to the broken support or resistance level and enter after price bounces.
总结:支撑和阻力

当市场的价格上升到某高点,然后回落的时候,在它回落之前所达到的最高点,就是目前的阻力。
随着市场价格的再次回升,在价格开始上升之前所达到的最低点就是目前的支撑。
要记住的一件事情是,支撑位和阻力位不是个确切的数字。
为了帮您筛选出那些假突破,您更应该将支撑和阻力考虑为一个“区域”,而不是具体的数字。
一种可以帮助你找到这些区域的方法,就是在线形图表上画出支撑和阻力线,而非在蜡烛图表上。
另一件需要记住的事情:当价格突破一个阻力位时,这一阻力位可能成为支撑位。同样的情况,如果支撑位被打破,那么它也可能成为阻力位。
趋势线
趋势线最基本的画法是,一条上升趋势线是沿着容易识别的支撑位底部绘出;在下跌趋势中,趋势线沿着容易识别的阻力位顶部绘出。
趋势有三种类型:
1. 上升趋势(逐渐升高的低点)
2. 下跌趋势(逐渐降低的高点)
3. 横盘趋势(区间震荡)
通道
要构成一个向上的通道,只需要按着和上升趋势线相同的角度,简单的画出一条和上升趋势线平行的线,然后把这条线移到最近的高点。
要构成一个向下的通道,只需要按着和下跌趋势线相同的角度,简单的画出一条和下跌趋势线平行的线,然后把这条线移到最近的低点。
通道有三种类型:
1. 上升通道(逐渐升高的高点和逐渐升高的低点)
2. 下降通道(逐渐降低的高点和逐渐降低的低点)
3. 横向通道(区间震荡)
使用支撑和阻力位来交易,可以分成两种方法:反弹和突破。
当我们在进行反弹交易的时候,我们需要辨识出对我们有利的胜算,并且找出有把握的支撑和阻力位。要等待它在进入前的第一次反弹,而不是简单的立即购买或者出售。这样做的话,你可以避开价格在快速波动的时候,突然突破支撑与阻力位。就像接住一把快速落下的刀子,通常会有发生流血的事件。
至于突破交易的方法,有激进和保守两种方式。关于激进方式,你只要在价格通过支撑和阻力位时,轻松地买进或卖出。关于保守的方式,你要等待价格的“回调”到达突破的支撑或阻力位后,并在价格反弹回时下单。