What Are Moving Averages?
A moving average is simply a way to smooth out price action over time. By “moving average”, we mean that you are taking the average closing price of a currency pair for the last ‘X’ number of periods. On a chart, it would look like this:

Like every indicator, a moving average indicator is used to help us forecast future prices. By looking at the slope of the moving average, you can better determine the potential direction of market prices.
As we said, moving averages smooth out price action.
There are different types of moving averages and each of them has their own level of “smoothness”.
Generally, the smoother the moving average, the slower it is to react to the price movement.
The choppier the moving average, the quicker it is to react to the price movement. To make a moving average smoother, you should get the average closing prices over a longer time period.
Now, you’re probably thinking, “C’mon, let’s get to the good stuff. How can I use this to trade?”
In this section, we first need to explain to you the two major types of moving averages:
- Simple
- Exponential
We’ll also teach you how to calculate them and give the pros and cons of each. Just like in every other lesson in the BabyPips.com School of Pipsology, you need to know the basics first!
After you’ve got that on lockdown like Argentinian soccer player Lionel Messi’s ball-handling skills, we’ll teach you the different ways to use moving averages and how to incorporate them into your trading strategy.
By the end of this lesson, you’ll be just as smooth as Messi’s!
Are you ready?
If you are, give us a “Heck yeah!”
If not, go back and reread the intro.
Once you’re pumped and ready to go, head to the next page.
什么是移动平均线
移动平均线是单纯的把价格的波动变得平滑的。 所谓的“移动平均”是指,那组货币对,之前一段’X’数量的收盘价平均值。 在图表上,它看起来就像这样: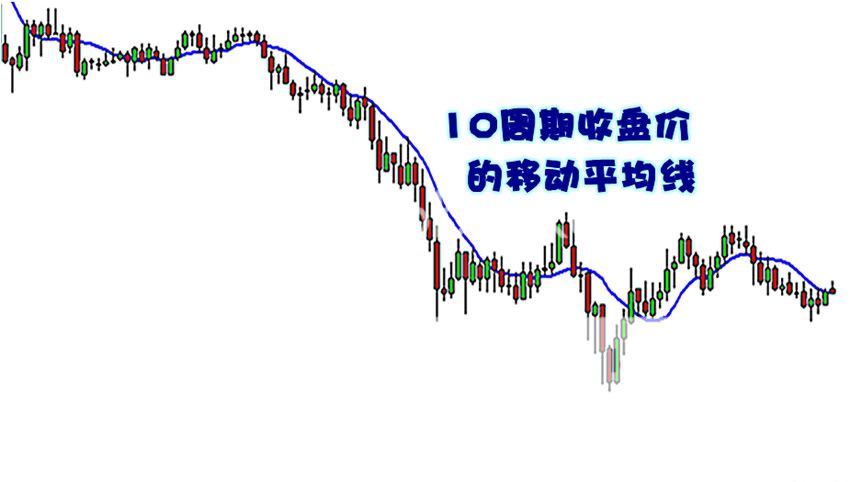
像每个指标一样,移动平均指标是用来帮助我们预测未来的价位。对移动平均的波动斜度进行观察,你可以更好的确定市场价格的潜在方向。
正如我们标题所说的,移动平均线平滑了价格的波动。
但是移动平均线也分成好几种,每一种都代表了各自的“平滑”类型。
一般而言,移动平均线越平滑,它对价格的变动所做出的反应就越慢。
反言之,移动平均线的波动越强,它对价格的反应就越快。 为了使平均线显得比较平滑,你应该使用较长周期的收盘价,来制作平均线。
现在,你可能会想,“快点吧,让我们把重点转到这好东西。我该怎样使用这个来交易呢?”
在本课中,我们首先需要向你解释,移动平均线的两个主要类型:
1. 简单的
2. 指数的
我们还会教你如何计算,以及告诉你,它们的优点和缺点。 就像在BabyPips.com学校的其他课程中一样,您需要先知道的基本的知识!
当你的均线技术,学得像阿根廷的球王梅西的控球技术之后,我们会教您移动平均线的不同使用方式,以及如何将他们纳入自己的交易策略当中。
到本课程结束时,你就会像梅西控球一样的平滑顺畅!
你准备好了吗?
如果你准备好了,给我们一个“真是爽!”的回应
如果没有,回去重读前面的课程。
一旦你整装待发,那么我们马上前往下一个页面。
Simple Moving Average (SMA) Explained
A simple moving average (SMA) is the simplest type of moving average in forex analysis (DUH!). Basically, a simple moving average is calculated by adding up the last “X” period’s closing prices and then dividing that number by X.
Confused???
Don’t worry, we’ll make it crystal clear.
Calculating the Simple Moving Average (SMA)
If you plotted a 5 period simple moving average on a 1-hour chart, you would add up the closing prices for the last 5 hours, and then divide that number by 5. Voila! You have the average closing price over the last five hours! String those average prices together and you get a moving average!
If you were to plot a 5-period simple moving average on a 10-minute currency chart, you would add up the closing prices of the last 50 minutes and then divide that number by 5.
If you were to plot a 5 period simple moving average on a 30 minute chart, you would add up the closing prices of the last 150 minutes and then divide that number by 5.
If you were to plot the 5 period simple moving average on the 4 hr. chart… Okay, okay, we know, we know. You get the picture!
Most charting packages will do all the calculations for you. The reason we just bored you (yawn!) with a “how to” on calculating simple moving averages is because it’s important to understand so that you know how to edit and tweak the indicator.
Understanding how an indicator works means you can adjust and create different strategies as the market environment changes.
Now, as with almost any other forex indicator out there, moving averages operate with a delay. Because you are taking the averages of past price history, you are really only seeing the general path of the recent past and the general direction of “future” short term price action.
Disclaimer: Moving averages will not turn you into Ms. Cleo the psychic!
Here is an example of how moving averages smooth out the price action.

On chart above, we’ve plotted three different SMAs on the 1-hour chart of USD/CHF. As you can see, the longer the SMA period is, the more it lags behind the price.
Notice how the 62 SMA is farther away from the current price than the 30 and 5 SMAs.
This is because the 62 SMA adds up the closing prices of the last 62 periods and divides it by 62. The longer period you use for the SMA, the slower it is to react to the price movement.
The SMAs in this chart show you the overall sentiment of the market at this point in time. Here, we can see that the pair is trending.
Instead of just looking at the current price of the market, the moving averages give us a broader view, and we can now gauge the general direction of its future price. With the use of SMAs, we can tell whether a pair is trending up, trending down, or just ranging.
There is one problem with the simple moving average: they are susceptible to spikes. When this happens, this can give us false signals. We might think that a new currency trend may be developing but in reality, nothing changed.
In the next lesson, we will show you what we mean, and also introduce you to another type of moving average to avoid this problem.
简单的移动平均线(SMA)
一条简单的移动平均线就是一条普通的单纯简单移动平均线(废话!)。 基本上,一个简单的移动平均线的计算方法是,把“X”周期的收盘价加在一起,然后除以“X”。
你感觉很困惑吗???
不要担心,我们稍后会让它清晰明了。
如果你要画 1小时,5周期简单移动平均线,你需要将5个,1小时的收盘价,加在一起然后除以5。 瞧! 这就是你在过去五个小时的平均收盘价! 把这些平均收盘价串在一起,你会得到一个移动平均线!
如果你要绘制一个10分钟的5周期简单移动平均值,你就需要把过去50分钟的收盘价相加,然后除以5。
如果你要绘制一个30分钟的5段简单移动平均线,就需要把过去150分钟的收盘价相加,然后除以5。
如果你要绘制4小时的5段简单移动平均线。 就需要。。。。。。 好的,好的,我们知道,我们知道。 你已经明白了!
大多数的图表会有指标为你做所有的计算。 我们之所以不厌其烦(又打哈欠!)的教你“怎样”计算简单的移动平均线,这是因为了解它非常重要,所以你已经知道了如何修改和调整该指标。
了解一个指标是如何运作的,意味着你可以根据市场环境的变化,自己调整和改变策略。
现在,就像其他的指标一样(除了肥婆),移动平均线也是个滞后指标。因为你得到的是,过去价格的平均价位,你仅仅只是看到了,最近的价格的总体波动路径和“未来”短期价格方向的预测。
免责声明:移动平均线不会让你变成闻名美国的超能力巫师 Miss Cleo!
下面是一个范例。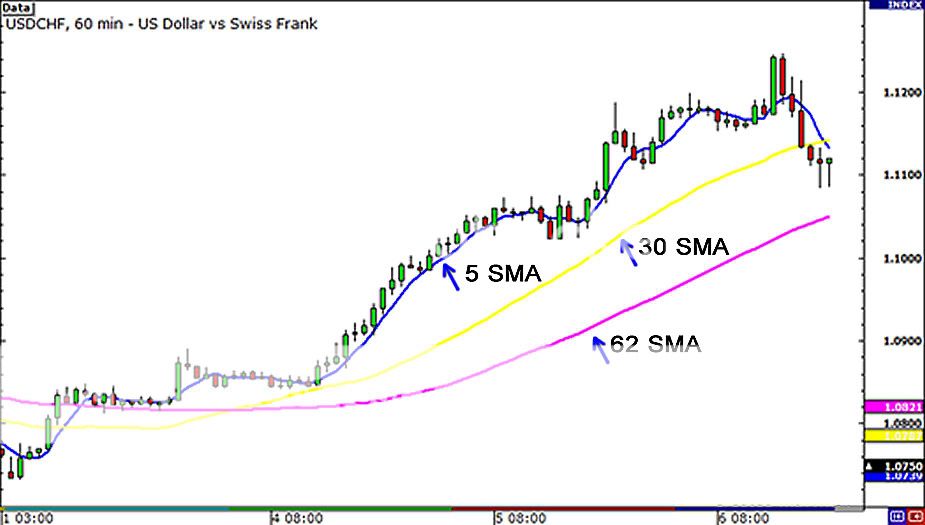
在图表上,我们已经绘制了三种不同的简单移动平均线,在1小时内美元/瑞郎的图表。 正如你所看到的,时间参数越大的平均线,价格越滞后。
请注意62期的这条平均线,它比30期和5期的平均线,更加远离当前价格。
这是因为62期的这条平均线,是加上过去62期的收盘价再除以62的缘故。 你使用的平均线的参数时间越大,它对价格做出的反应就越迟钝。
但这个图中的简单平均线告诉你,市场在这段时间内的整体氛围。 在这里,我们可以看出,这货币对正处于趋势中。
这样让我们不是仅仅只是,以现在的价格波动来看待市场,简单平均线给了我们一个更广阔的视野,让我们对价格的未来波动方向,可以给出一个总体预估。 随着简单平均线的使用,我们可以判断一组货币对是上升中、下降中,还是震荡中。
但是,简单平均线也有一个问题,那就是他们的反应比较迟钝。 当发生这种情况时,往往会造成我们的买卖信号滞后。
在下一课中,我们将向您展示我们的意思,也向您介绍另一种移动平均线,以避免这一问题的产生。 Exponential Moving Average (EMA) Explained
As we said in the previous lesson, simple moving averages can be distorted by spikes. We’ll start with an example.
Let’s say we plot a 5-period SMA on the daily chart of EUR/USD.

The closing prices for the last 5 days are as follows:
Day 1: 1.3172
Day 2: 1.3231
Day 3: 1.3164
Day 4: 1.3186
Day 5: 1.3293
The simple moving average would be calculated as follows:
(1.3172 + 1.3231 + 1.3164 + 1.3186 + 1.3293) / 5 = 1.3209
Simple enough, right?
Well what if there was a news report on Day 2 that causes the euro to drop across the board. This causes EUR/USD to plunge and close at 1.3000. Let’s see what effect this would have on the 5 period SMA.
Day 1: 1.3172
Day 2: 1.3000
Day 3: 1.3164
Day 4: 1.3186
Day 5: 1.3293
The simple moving average would be calculated as follows:
(1.3172 + 1.3000 + 1.3164 + 1.3186 + 1.3293) / 5 = 1.3163
The result of the simple moving average would be a lot lower and it would give you the notion that the price was actually going down, when in reality, Day 2 was just a one-time event caused by the poor results of an economic report.
The point we’re trying to make is that sometimes the simple moving average might be too simple. If only there was a way that you could filter out these spikes so that you wouldn’t get the wrong idea. Hmm… Wait a minute… Yep, there is a way!
It’s called the Exponential Moving Average!
Exponential moving averages (EMA) give more weight to the most recent periods. In our example above, the EMA would put more weight on the prices of the most recent days, which would be Days 3, 4, and 5.
This would mean that the spike on Day 2 would be of lesser value and wouldn’t have as big an effect on the moving average as it would if we had calculated for a simple moving average.
If you think about it, this makes a lot of sense because what this does is it puts more emphasis on what traders are doing recently.
Exponential Moving Average (EMA) and Simple Moving Average (SMA) Side By Side
Let’s take a look at the 4-hour chart of USD/JPY to highlight how a simple moving average (SMA) and exponential moving average (EMA) would look side by side on a chart.

Notice how the red line (the 30 EMA) seems to be closer price than the blue line (the 30 SMA). This means that it more accurately represents recent price action. You can probably guess why this happens.
It’s because the exponential moving average places more emphasis on what has been happening lately. When trading, it is far more important to see what traders are doing NOW rather what they were doing last week or last month.
指数移动平均线
正如我们上节课讲到的,简单移动平均线走势能够受到价格短期内的巨幅波动而歪曲。
让我们看看欧元/美元5日移动均线。

汇价在过去5日的收盘价分别是:
第一天:1.3172
第二天:1.3231
第三天:1.3164
第四天:1.3186
第五天:1.3293
简单移动平均线计算结果如下:
(1.3172 + 1.3231 + 1.3164 + 1.3186 + 1.3293) / 5 = 1.3209
很简单,是吗?
那么,如果第二天有突发事件导致欧元/美元收盘下跌并收于1.3000呢。让我们看看这一变动对欧元/美元5日简单移动均线所造成的影响。
第一天:1.3172
第二天:1.3000
第三天:1.3164
第四天:1.3186
第五天:1.3293
简单移动均线计算结果将变为:
(1.3172 + 1.3000 + 1.3164 + 1.3186 + 1.3293) / 5 = 1.3163
这一简单移动均线的计算结果将较之前低很多,并可能给你造成这一印象,即价格实际上在走低,而实际上,第二天的价格走势只是受到糟糕经济数据影响而出现的单日事件。
我们需要指出来的是,简单移动均线有些时候可能过于简单。如果你能够滤除掉这些短期过度波动因素,那么你就不会得出错误的判断结论。
指数移动平均线就是一种方法!
指数移动平均线(EMA)给予最近时段的权重更大。在我们之前所给的例子中,指数移动均线将给予价格在最近几天更高的权重,这将是第三天、第四天和第五天。
这意味着价格在第二天的巨大波动并不会和我们通过简单移动均线计算的那样,对移动均线的走势造成大的影响。
如果你注意到这一点,这将是十分有意义的,因为指数移动均线所强调的是交易者最近的行为。
让我们看看美元/日元4小时图中,SMA和EMA在同一图形中的不同走势。

注意:红色曲线(30EMA)较蓝线(30SMA)更接近价格走势。这意味着,红色曲线更能代表近期的价格走势。你很可能能够猜出这是怎么发生的。
因为EMA更加强调最近的价格走势,近期交易者行为远要重要,而非是他们在上周或上个月的交易行为。
Simple vs. Exponential Moving Averages
By now, you’re probably asking yourself, which is better? The simple or the exponential moving average?
First, let’s start with the exponential moving average. When you want a moving average that will respond to the price action rather quickly, then a short period EMA is the best way to go.
These can help you catch trends very early (more on this later), which will result in higher profit. In fact, the earlier you catch a trend, the longer you can ride it and rake in those profits (boo yeah!).
The downside to using the exponential moving average is that you might get faked out during consolidation periods (oh no!).
Because the moving average responds so quickly to the price, you might think a trend is forming when it could just be a price spike. This would be a case of the indicator being too fast for your own good.
With a simple moving average, the opposite is true. When you want a moving average that is smoother and slower to respond to price action, then a longer period SMA is the best way to go.
This would work well when looking at longer time frames, as it could give you an idea of the overall trend.
Although it is slow to respond to the price action, it could possibly save you from many fake outs. The downside is that it might delay you too long, and you might miss out on a good entry price or the trade altogether.
An easy analogy to remember the difference between the two is to think of a hare and a toirtoise.

The tortoise is slow, like the SMA, so you might miss out on getting in on the trend early. However, it has a hard shell to protect itself, and similarly, using SMAs would help you avoid getting caught up in fakeouts.
On the other hand, the hare is quick, like the EMA. It helps you catch the beginning of the trend but you run the risk of getting sidetracked by fakeouts (or naps if you’re a sleepy trader).
Below is a table to help you remember the pros and cons of each.
| SMA | EMA | |
|---|---|---|
| Pros | Displays a smooth chart which eliminates most fakeouts. | Quick Moving and is good at showing recent price swings. |
| Cons | Slow moving, which may cause a a lag in buying and selling signals | More prone to cause fakeouts and give errant signals. |
So which one is better?
It’s really up to you to decide.
Many traders plot several different moving averages to give them both sides of the story. They might use a longer period simple moving average to find out what the overall trend is, and then use a shorter period exponential moving average to find a good time to enter a trade.
There are a number of trading strategies that are built around the use of moving averages. In the following lessons, we will teach you:
- How to use moving averages to determine the trend
- How to incorporate the crossover of moving averages into your trading system
- How moving averages can be used as dynamic support and resistance
Time for recess! Go find a chart and start playing with some moving averages! Try out different types and try experimenting with different periods. In time, you will find out which moving averages work best for you.
简单平均线VS指数平均线
现在,你可能会问自己,哪个更好? 是简单或指数移动平均线?
首先,让我们先从指数移动平均线(EMA)开始。 当你想要相当快速地反映移动平均价位的时候,那么一个短周期的指数平均线,是最好的选择。
它可以帮助你非常快的逮到趋势(稍后详解),而这通常意味着致更高的获利。事实上,你越早的抓住一个趋势,你就拥有越长的时间可以骑着它,四处去敛集你的财富(哇~)。
但使用指数移动平均线的缺点在于,它可能会在市场盘整的时期内,时常欺骗你(哦,不!)。
由于这类移动平均线如此迅速地反应价位,所以你可能因为它的反应,而认为趋势已经形成的时候,而这可能仅仅只是一个价格突变时的上涨。这是针对指标太快时的,其中一种情况。
但对于简单移动平均线,它则具有过滤这种价格短期突变的优势。 当你想要一条更加平滑,和对价格的反应稍慢的移动平均线时,那么一个较长时间周期的SMA是最好的选择。
虽然简单移动平均线对价格波动的反应比较缓慢,但它却能从很多的假讯息中,把你给拯救出来。 缺点是,它可能会滞后太长的时间,而你可能错过一个较好的下单价位或交易机会。
一个简单的比喻,两者之间的区别就像一只兔子和一只乌龟。
乌龟是缓慢的,如SMA,所以你可能会错过早期的趋势。 然而,它有一个坚硬的外壳来保护自己,同样,使用SMA会帮助你避免陷入假讯号中。
而另一边,兔子的反应快,像EMA。 它可以帮助你赶上趋势,但你需要冒着被假讯号引开注意力的风险(或是冒着它偷睡的风险,如果你是一个瞌睡的交易者的话)。
下面是一个表,是帮助你分别记住它们的优缺点的。
SMA EMA
优点 消除多数的假讯号,给你一个平滑的图表。 快速移动,可以很好的显示出近期的价格趋势。
缺点 滞后,这可能导致买卖信号落后。 容易被假讯号讯息,而给出错误的交易信号。
那么,哪一个更好呢?
这答案相当大程度取决于你的决定。
许多交易者通过叠加几种不同类型和周期的移动平均线,来分析两中均线所表达的情况。 他们可能会用一条较长周期的简单移动平均线,来找出整体的趋势。然后再使用一条较短周期的指数移动平均线,来找到一个下单进场的好时机。
有许多的交易策略都是围绕着移动平均线的基础建立的。 在接下来的课程中,我们将教你:
1. 如何使用移动平均线来确定趋势
2. 如何把交叉的移动平均线,纳入你的交易系统
3. 怎样利用移动平均线,作为动态的支撑或阻力位
又到了休息时间! 去找一个图表,并开始与一些移动平均线玩玩! 尝试不同类型、不同周期期的移动平均线, 随着一段时间的实验,你会发现哪些平均线最适合你。