What is a Japanese Candlestick?
While we briefly covered Japanese candlestick charting analysis in the previous forex lesson, we’ll now dig in a little and discuss them more in detail. Let’s do a quick review first.
Japanese Candlestick Trading
Back in the day when Godzilla was still a cute little lizard, the Japanese created their own old school version of technical analysis to trade rice. That’s right, rice.
A Westerner by the name of Steve Nison “discovered” this secret technique called “Japanese candlesticks,” learning it from a fellow Japanese broker. Steve researched, studied, lived, breathed, ate candlesticks, and began to write about it. Slowly, this secret technique grew in popularity in the 90’s. To make a long story short, without Steve Nison, candlestick charts might have remained a buried secret. Steve Nison is Mr. Candlestick.
Okay, so what the heck are Japanese candlesticks?
The best way to explain is by using a picture:

Japanese candlesticks are formed using the open, high, low, and close of the chosen time period.
- If the close is above the open, then a hollow candlestick (usually displayed as white) is drawn.
- If the close is below the open, then a filled candlestick (usually displayed as black) is drawn.
- The hollow or filled section of the candlestick is called the “real body” or body.
- The thin lines poking above and below the body display the high/low range and are called shadows.
- The top of the upper shadow is the “high”.
- The bottom of the lower shadow is the “low”.
什么是日本蜡烛图?
在之前的课程当中,我们对于蜡烛图图标进行了简单的介绍,现在,我们要更深入地对它的细节进行讨论。首先,我们先快速地回顾一遍。
什么是蜡烛图贸易?
当动画人物哥斯拉还是只是个可爱的小蜥蜴时,日本人就已经创造了交易大米的技术分析秘籍。是的,大米。
一个名叫Steve Nison的西方人从他的日本经纪那得知了这个被称为“蜡烛图”的神秘技术。史提芬开始不断地深入地探索、研究、发掘这项技术,并且进行记录。慢慢地,这项神秘技术在九十年代被广为传播。简单地说,如果没有Steve Nison,烛台图表或许将会是一个长埋于地底的秘密。Steve Nison就是西方蜡烛图之父。
那么,外汇蜡烛图是长什么鬼样呢?
最好的方法就是用图表来进行解释: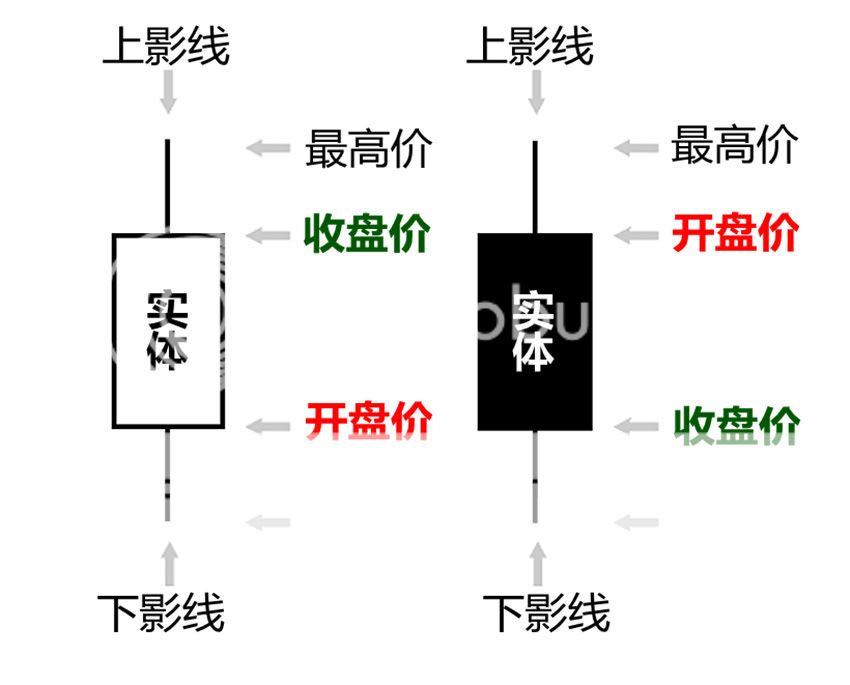
蜡烛图可以在你需要的任何时间框架内使用,一天,一小时,或者是三十分钟。我们可以在有限的时间框架内用烛台来描述价格波动。蜡烛图通过选择时间内的开盘价,最高价,最低价和收盘价来形成。
•如果收盘高于开户,就表示为一个空心烛台(通常是白色)。
•如果收盘低于开户,就表示为一个实心烛台(通常是黑色)。
•烛台的空心或者实心部分被称为实体。
•在实体上面或者下面的细线表示高或低水平,被称为影线。
•上影线的顶端表示最高价。
•下影线的底部表示最低价。 Japanese Candlestick Anatomy

Sexy Bodies
Just like humans, candlesticks have different body sizes. And when it comes to forex trading, there’s nothing naughtier than checking out the bodies of candlesticks!
Long bodies indicate strong buying or selling. The longer the body is, the more intense the buying or selling pressure. This means that either buyers or sellers were stronger and took control.
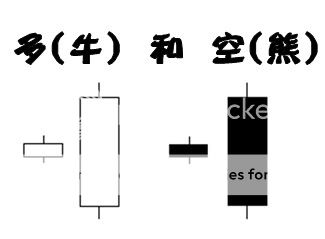
Short bodies imply very little buying or-selling activity. In street forex lingo, bulls mean buyers and bears mean sellers.

Long black (filled) candlesticks show strong selling pressure. The longer the black Japanese candlestick, the further the close is below the open. This indicates that prices fell a great deal from the open and sellers were aggressive. In other words, the bears were grabbing the bulls by their horns and body-slamming them.
Mysterious Shadows
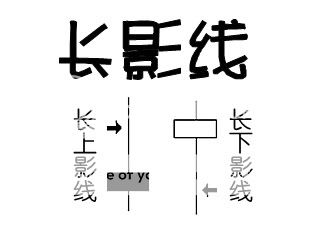
The upper and lower shadows on Japanese candlesticks provide important clues about the trading session.
Upper shadows signify the session high. Lower shadows signify the session low.
Candlesticks with long shadows show that trading action occurred well past the open and close.
Japanese candlesticks with short shadows indicate that most of the trading action was confined near the open and close.

If a Japanese candlestick has a long lower shadow and short upper shadow, this means that sellers flashed their washboard abs and forced price lower, but for one reason or another, buyers came in and drove prices back up to end the session back near its open price.
日本蜡烛图解析
性感的身材
和人类一样,蜡烛也有不同的尺寸。而且,当涉及到外汇交易,没有什么比检查蜡烛的形态更有趣的了!
长的身形表示强烈的买进或卖出。身体越长,买进或卖出的力度就越强劲。这意味着要么买家力度大要么卖家力度大。
短的身形意味着很少购买或进行销售活动。在外汇街头的行话中,牛指买家,熊指卖家。
长长的白蜡烛显示出强劲的购买压力。白蜡烛越长,结束时的最高价会越高。这表明,从开盘到收盘价格有大幅上升,而且买家咄咄逼人。换句话说,公牛狠狠踢了熊的屁股一顿!
长长的黑色(实心的)蜡烛表现出强烈的抛售压力。黑蜡烛越长,结束时的最低价会越高。这表明,从开盘到收盘价格下跌了很多,而且卖家咄咄逼人。换句话说,熊紧抓着公牛的角后往躯体上猛踹。
神秘的影线
蜡烛上下方的影线为有关交易时段了提供重要线索。
上方的影线意味着盘中高点。下方影线意味着盘中低点。
有长影线的蜡烛表明,交易活动远离了开盘和收盘的价格。
有短影线的蜡烛表明,大部分的交易活动都限制在开盘和收盘的价格附近。
如果一个蜡烛上影线很长,下影线很短,这意味着买家曾推高价格,但由于某种原因,卖家积极的抛售,使价格结束时回落到它开始时的价格。
如果一个蜡烛有着长下影线和短上影线,这意味着卖方曾被迫降低价格,由于某种原因买家积极的进入,使价格结束时回升到它开始时的价格。
Basic Japanese Candlestick Patterns
Spinning Tops
Japanese candlesticks with a long upper shadow, long lower shadow and small real bodies are called spinning tops. The color of the real body is not very important.
The pattern indicates the indecision between the buyers and sellers.

Even though the session opened and closed with little change, prices moved significantly higher and lower in the meantime. Neither buyers nor sellers could gain the upper hand, and the result was a standoff.
If a spinning top forms during an uptrend, this usually means there aren’t many buyers left and a possible reversal in direction could occur.
If a spinning top forms during a downtrend, this usually means there aren’t many sellers left and a possible reversal in direction could occur.
Marubozu
Sounds like some kind of voodoo magic, huh? “I will cast the evil spell of the Marubozu on you!” Fortunately, that’s not what it means. Marubozu means there are no shadows from the bodies. Depending on whether the candlestick’s body is filled or hollow, the high and low are the same as its open or close. Check out the two types of Marubozus in the picture below.

A Black Marubozu contains a long black body with no shadows. The open equals the high and the close equals the low. This is a very bearish candle as it shows that sellers controlled the price action the entire session. It usually implies bearish continuation or bearish reversal.
Doji
Doji candlesticks have the same open and close price or at least their bodies are extremely short. A doji should have a very small body that appears as a thin line.
Doji candles suggest indecision or a struggle for turf positioning between buyers and sellers. Prices move above and below the open price during the session, but close at or very near the open price.
Neither buyers nor sellers were able to gain control and the result was essentially a draw.
There are four special types of Doji candlesticks. The length of the upper and lower shadows can vary and the resulting forex candlestick looks like a cross, inverted cross or plus sign. The word “Doji” refers to both the singular and plural form.

If a Doji forms after a series of candlesticks with long hollow bodies (like White Marubozus), the Doji signals that the buyers are becoming exhausted and weakening. In order for price to continue rising, more buyers are needed but there aren’t anymore! Sellers are licking their chops and are looking to come in and drive the price back down.


In the next following sections, we will take a look at specific Japanese candlestick pattern and what they are telling us. Hopefully, by the end of this lesson on candlesticks, you will know how to recognize different types of forex candlestick patterns and make sound trading decisions based on them.
基本蜡烛图形态
纺锤顶
拥有长上影线、长下影线和较小实体的蜡烛线称为纺锤顶。实体部分的颜色并不那么重要。
该形态表明买卖双方之间的 犹豫不决。
小的实体,不管是阳线还是阴线,均显示汇收盘价和开盘价相比变动不大,而且,影线部分显示出,买卖双方斗争激烈,但没人能够占到上风。
尽管汇价收盘价和开盘价相比变动不大,但是在时段以内,价格却经历了显著的波动。买方和卖方都难以占到上风,结果就是打成平手。
如果纺锤顶形态在上升趋势中形成,这通常意味着,市场上尚存的买方不多,运行方向很有可能出现反转。
如果纺锤顶形态在下跌趋势中形成,这通常意味着,市场上尚存的卖方已所剩无几,而这也很可能就是市场行情反转的开始。
光头光脚形态
光头光脚意味着蜡烛线不存在上下影线。根据实体部分颜色的不同,光头光脚形态分成以下两种:白色光头光脚和黑色光头光脚。
白色光头光脚 包含长的白色实体部分,但没有上下影线。开盘价格即为当天最低价,而收盘价则为当天最高价。这是一个极度看涨形态,因为它显示出,在整个交易时段,买方始终控制着整个市场。它通常成为牛市持续形态或反转看多形态的第一部分。
黑色光头光脚包含长的黑色实体部分,但没有上下影线。开盘价即为当天的最高价,而收盘价则为当天的最低价。这是一个极度看跌形态,因为它显示出,在整个交易时段,卖方始终控制着整个市场。它通常成为熊市持续形态或反转看空形态的第一部分。
十字星
十字星拥有相同的开收盘价,或者是它们的实体部分极度之短。十字星的身形应该非常小,它看上去就像是一根细线。
十字星形态意味着市场的犹豫不决,或买方和卖方之间的势均力敌。在时段以内,价格突破或跌破开盘价,但是最终却收在非常接近开盘价的水平。
卖方或卖方均难以控制整个市场行情,结果就是打成平局。
十字星有四种特别形态。它们是长脚十字线(Long-legged Doji)、蜻蜓十字线(Dragonfly Doji)、墓碑十字线(Gravestone Doji)以及一字线(Four Price Doji)。
当十字星形态形成时,需要对紧随出现的蜡烛线保持特别注意。
如果十字星出现在长阳线(比如说白色光头光脚形态)后,这显示买方力量正趋于枯竭。为进一步推高汇价,需要有更多的买方介入,但市场上却不再有这么多买方。卖方正虎视眈眈,并寻求做空机会。
PS:长阳线+十字星
如果十字星出现在长阴线(比如说黑色光头光脚形态)后,这显示出卖方力量正在衰竭。为进一步打压汇价走低,需要有更多的卖方介入,但是市场上卖方已经弹尽粮绝他们无力再推低汇价。这时候,买方在低位买进,新一轮上升行情指日可待。
PS:长阴线+十字星
尽管由于缺乏新的卖盘而导致汇价跌势停止,但仍需要进一步的买盘来证实反转的确立。我们可以等待白色蜡烛线收于长阴线蜡烛线开盘价上方来确立趋势的反转。
在下一课,我们将学习具体的蜡烛线形态以及它们的意义。希望在蜡烛线本系列课程结束后,你将知道如何识别蜡烛线形态并基于这些知识作出稳定的交易策略。
Single Candlestick Patterns
Learn how to use single candlestick patterns to identify potential market reversals.
Here are the four basic single Japanese candlestick patterns:
Hammer and Hanging Man
The hammer and hanging man look exactly alike but have totally different meanings depending on past price action. Both have cute little bodies (black or white), long lower shadows, and short or absent upper shadows.


When price is falling, hammers signal that the bottom is near and price will start rising again. The long lower shadow indicates that sellers pushed prices lower, but buyers were able to overcome this selling pressure and closed near the open.
Just because you see a hammer form in a downtrend doesn’t mean you automatically place a buy order! More bullish confirmation is needed before it’s safe to pull the trigger.
A typical example of confirmation would be to wait for a white candlestick to close above the open to the right side of the hammer.
Recognition Criteria:
- The long shadow is about two or three times of the real body.
- Little or no upper shadow.
- The real body is at the upper end of the trading range.
- The color of the real body is not important.
The hanging man is a bearish reversal pattern that can also mark a top or strong resistance level. When price is rising, the formation of a hanging man indicates that sellers are beginning to outnumber buyers.
The long lower shadow shows that sellers pushed prices lower during the session. Buyers were able to push the price back up some but only near the open.
This should set off alarms since this tells us that there are no buyers left to provide the necessary momentum to keep raising the price.
Recognition Criteria:
- A long lower shadow which is about two or three times of the real body.
- Little or no upper shadow.
- The real body is at the upper end of the trading range.
- The color of the body is not important, though a black body is more bearish than a white body.
Inverted Hammer and Shooting Star
The inverted hammer and shooting star also look identical. The only difference between them is whether you’re in a downtrend or uptrend. Both candlesticks have petite little bodies (filled or hollow), long upper shadows, and small or absent lower shadows.


However, sellers saw what the buyers were doing, said “Oh heck no!” and attempted to push the price back down.
Fortunately, the buyers had eaten enough of their Wheaties for breakfast and still managed to close the session near the open.
Since the sellers weren’t able to close the price any lower, this is a good indication that everybody who wants to sell has already sold. And if there are no more sellers, who is left? Buyers.
The shooting star is a bearish reversal pattern that looks identical to the inverted hammer but occurs when price has been rising. Its shape indicates that the price opened at its low, rallied, but pulled back to the bottom.
This means that buyers attempted to push the price up, but sellers came in and overpowered them. This is a definite bearish sign since there are no more buyers left because they’ve all been murdered.
单蜡烛模式
垂头和上吊线看上去一模一样,但基于过去的不同价格走势,其表达的意义完全不同。两者都有较短的实体(黑色或白色),长下影线,短的或不存在的上影线。
垂头是一个看涨反转形态,通常出现在市场下跌的尾部。
当价格下跌,垂头表明底部已经临近,价格将开始回升。长下影线表明,卖家推动价格较低,但买家能够克服这种抛售压力。
仅仅因为你看到在下跌趋势中垂头的形成,并不意味着你就应该随即设定买入订单。在你设定买入订单之前,你需要更多的信号来确定牛市的到来。
能够确定反转形态到来的例子是:等到第二根蜡烛线收于垂头的开盘价。
确认标准:
★长影是实体的两三倍。
★很少或没有上影线。
★实体部分在交易范围的上限。
★实体颜色并不重要。
上吊线是一个看跌反转形态,也标志着一个顶级或强阻力位置。当价格上升,形成一个上吊线,表示卖家开始多于买家。
长下影线显示卖家在较低开盘价格推动价格。买家能够推动价格回涨。
这应该引起我们的注意,因为它告诉我们,市场上没有多余的买方为价格的进一步上涨提供必要的动能。
确认标准:
★长下影线大约是实体的两倍或三倍。
★很少或没有上影线。
★实体在交易区间的上限。
★蜡烛线实体的颜色并不重要,但黑色实体较白色实体看跌信号更明显。
倒锤头和射击之星
倒垂头和射击之星也十分类似。唯一的不同在于,倒垂头出现在下降趋势中,而射击之星出现在上升趋势中。两种形态都拥有小的实体部分(阴线或阳线),长的上影线、小的下影线或不存在下影线。
倒锤头发生在价格下降暗示了逆转的可能性时。它的长上影线显示,买家试图出更高的价格。
然而,当卖家看到买家的行为,说道:“哦,见鬼。”他随即试图推动价格回落。
幸运的是,买方仍有足够的气力推动价格回归至开盘时水平。
有鉴于卖方已没有能力推动价格进一步走低,这明显表明,之前打算卖出的投资者均已经卖出。如果市场上已无更多的卖方,那么谁将充当卖方?答案是之前的买方。
射击之星是一个看跌形态,看上去和倒垂头形态一模一样,但发生在价格已经出现持续上涨过程中。该形态表明,价格开于低点,随后走高,但最终回撤至底部水平。
这意味着买方试图推动价格走高,但卖方随之涌现,且力量超过买方。由于市场上不存在更多的买方,这时已发出明确的看跌信号。
Dual Candlestick Patterns
Engulfing Candles

The bullish engulfing pattern is a two candlestick pattern that signals a strong up move may be coming. It happens when a bearish candle is immediately followed by a larger bullish candle.
This second candle “engulfs” the bearish candle. This means buyers are flexing their muscles and that there could be a strong up move after a recent downtrend or a period of consolidation.
On the other hand, the bearish engulfing pattern is the opposite of the bullish pattern. This type of candlestick pattern occurs when the bullish candle is immediately followed by a bearish candle that completely “engulfs” it. This means that sellers overpowered the buyers and that a strong move down could happen.
Tweezer Bottoms and Tops
The tweezers are dual candlestick reversal patterns. This type of candlestick pattern are usually be spotted after an extended uptrend or downtrend, indicating that a reversal will soon occur.
Notice how the candlestick formation looks just like a pair of tweezers!
Amazing!

The most effective Tweezers have the following characteristics:
- The first candlestick is the same as the overall trend. If price is moving up, then the first candle should be bullish.
- The second candlestick is opposite the overall trend. If price is moving up, then the second candle should be bearish.
- The shadows of the candlesticks should be of equal length. Tweezer Tops should have the same highs, while Tweezer Bottoms should have the same lows.
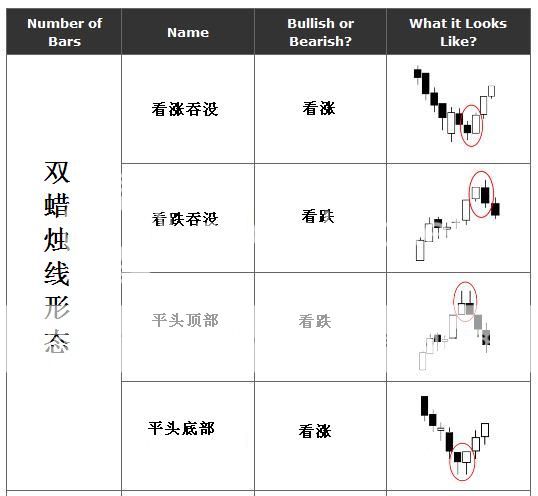
难上加难 – 双蜡烛线形态
吞没形态
看涨吞没形态由两根蜡烛构成,它暗示市场将出现持续的走强行情。
如图,市场本来处于下降趋势之中,但后来出现一根坚挺的白色实体,这根白色实体将它前面的那根黑色实体“抱进怀里了”,或者说把它吞没了。
这种情况说明市场上买进的压力已经压倒了卖出压力。
看跌吞没形态和看涨吞没恰恰相反。看跌吞没形态说明,市场原本正朝着更高的价格趋升。但前一个白色实体被后一个黑色实体吞没后,就构成了顶部反转的信号。
这种情况说明,熊方已经从牛方手中夺走了统治权。
平头顶部和平头底部形态
平头形态是由具有几乎相同水平最高点的两根蜡烛线组成的,或是由具有几乎相同的最低点的两根蜡烛线组成。
之所以将这种形态称为平头形态,是因为这些蜡烛线的端点就像镊子腿一样平齐。
最有效的平台形态具有一些特征:
● 第一根蜡烛线和此前总体市场趋势保持一致。如果价格处于上升趋势中,第一根蜡烛线应该是阳线。
● 第二根蜡烛线和总体趋势相反。如果价格上涨,那么,第二根蜡烛线应该是阴线。
● 两根蜡烛线的阴影部分长度应该相同。平头顶部形态应该具有相同的高点,而平头底部形态应该具有相同的低点。 Triple Candlestick Patterns
Evening and Morning Stars

- The first candlestick is a bullish candle, which is part of a recent uptrend.
- The second candle has a small body, indicating that there could be some indecision in the market. This candle can be either bullish or bearish.
- The third candlestick acts as a confirmation that a reversal is in place, as the candle closes beyond the midpoint of the first candle.
Three White Soldiers and Black Crows

The first of the three soldiers is called the reversal candle. It either ends the downtrend or implies that the period of consolidation that followed the downtrend is over.
For the pattern to be considered valid, the second candlestick should be bigger than the previous candle’s body. Also, the second candlestick should close near its high, leaving a small or non-existent upper wick.
For the three white soldiers pattern to be completed, the last candlestick should be at least the same size as the second candle and have a small or no shadow.
The three black crows candlestick pattern is just the opposite of the three white soldiers. It is formed when three bearish candles follow a strong uptrend, indicating that a reversal is in the works.
The second candle’s body should be bigger than the first candle and should close at or very near its low. Finally, the third candle should be the same size or larger than the second candle’s body with a very short or no lower shadow.
Three Inside Up and Down

- The first candle should be found at the bottom of a downtrend and is characterized by a long bearish candlestick.
- The second candle should at least make it up all the way up to the midpoint of the first candle.
- The third candlestick needs to close above the first candle’s high to confirm that buyers have overpowered the strength of the downtrend.
Conversely, the three inside down candlestick formation is found at the top of an uptrend. It means that the uptrend is possibly over and that a new downtrend has started. A three inside down candlestick formation needs have the following characteristics:
- The first candle should be found at the top of an uptrend and is characterized by a long bullish candlestick.
- The second candle should make it up all the way down the midpoint of the first candle.
- The third candlestick needs to close below the first candle’s low to confirm that sellers have overpowered the strength of the uptrend.
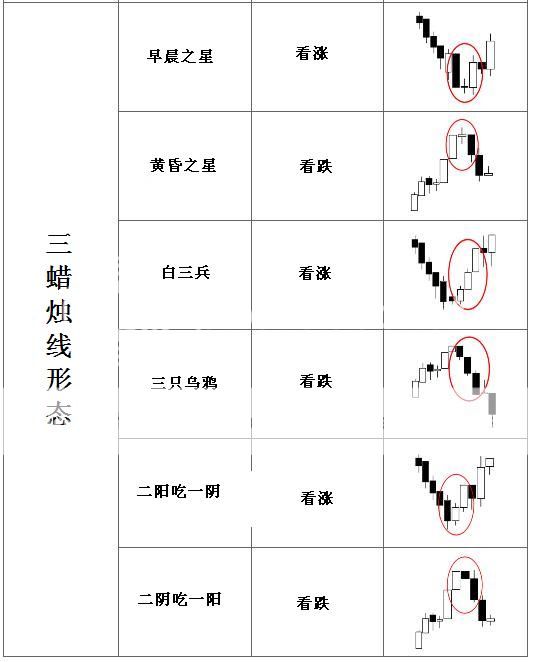
三不拥挤 – 三蜡烛线形态
早晨之星和黄昏之星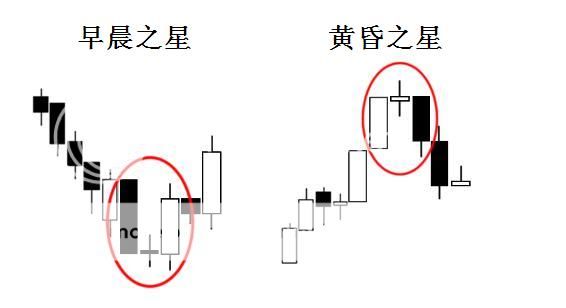
“早晨之星”顾名思义:就是在太阳尚未升起的时候,黎明前最黑暗的时刻,一颗明亮的启明星在天边指引着那些走向光明的夜行人,前途当然看好。
在外汇市场上,K线图上的“早晨之星”即预示着跌势将尽,市场处于拉升的前夜,行情摆脱下跌的阴影,逐步走向光明。
早晨之星一般由3个交易日的3根K线构成:
第一天,价格继续下跌,并且由于恐慌性的抛盘而出现一根巨大的阴线,大势不妙。
第二天,跳空下行,但跌幅不大,实体部分较短,形成星的主体部分。构成星的部分,既可以是阴线,也可以是阳线。
第三天,一根长阳线拔地而起,价格收复第一天的大部分失地,市场发出明显看涨信号。
黄昏之星的图形,预示市场趋势已经见顶,卖出的时机悄然来临。 黄昏之星充当顶部的几率非常之高,在牛势的后期,要特别警惕这种反转信号。
黄昏之星也是由3根K线组成:
第一天,市场在一片狂欢之中继续涨势,并且拉出一根长阳线。
第二天,继续冲高,但尾盘回落,形成上影线,实体部分窄小,构成星的主体。
第三天,突然下跌,间或出现恐慌性抛压,价格拉出长阴,抹去了前两天大部分走势。
“黄昏之星”是由三支阴阳烛组成的转向利淡形态,通常在一个上升趋势后出现。
1、第一支烛为承接前期上升走势的大阳烛,买盘强劲,显示升势持续。
2、第二支烛可为出现在裂口高开后的十字星或纺锤。此讯号显示买方压力逐步得以舒缓,价格大有可能已见顶。倘若第二支烛有着与射击之星相同的上影线,利淡转向讯号的可靠性更大为提高。
3、第三支烛为沽盘强劲的阴烛。此时市况已发生根本的转变,跌势一直持续到收市。
白三兵和三只乌鸦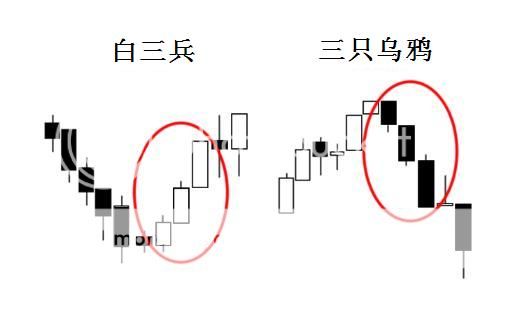
“白三兵”是由三根蜡烛线所组成的K线组合形态。在下降趋势中,该形态发出强烈的反转信号。
这种价格运动行为非常看涨,不容忽视。白三兵形态的特征如下:
1、三根连续的长阳线,每天出现更高的收盘价;
2、每天的开盘价应该在前一天的实体之内
3、每天的收盘价应该在当天最高点或接近最高点
“三只乌鸦”是一种K线组合形态,是指价格在运行时突然出现连续三根阴线的K线组合,是一种看跌信号。
三天收盘价一天比一天低,并且每天收盘价基本都是当天最低。
三只乌鸦由三只阴线构成:
如果出现在顶部和下降途中,而且三日的收盘价都向下跌,表示卖盘很重需要及时卖出。
如果在上升趋势的中后期,表示价格已处于相对较高的水平时,也应及时卖出。
三只乌鸦为典型的见顶回落K线组合,其技术特征:
1、连续出现三只阴线;
2、每日收盘价都向下跌;
3、收盘价接近每日的最低价位;
4、每日的开盘价都在上根K线的实体部分之内;
5、第一根阴线的实体部分,最好低于上日的最高价位。
两阳吃一阴与两阴吃一阳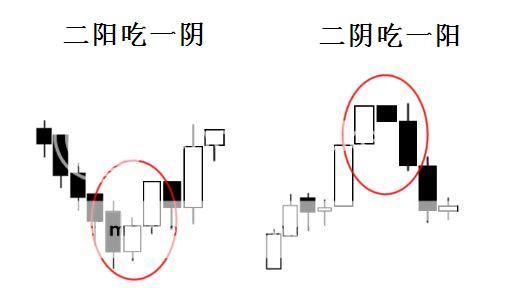
“两阳吃一阴”是一个典型的反转形态,该形态出现在下降趋势的底部。它于是价格的下降趋势很可能趋于尾声,并预示着新一轮涨势的开启。
两阳吃一阴特征如下:
1、第一根蜡烛线应该在出现在下降趋势的底部,且应该为一根长阴线;
2、第二根蜡烛线为阳线,且至少应该收于第一根蜡烛线的中部水平上方;
3、第三根蜡烛线需要收于第一根蜡烛线的上方,以证实买方力量已经超过之前主导下跌趋势的卖方力量
与之相对的是,“两阴吃一阳”出现在上升趋势的顶部。该形态意味着上升趋势很可能已经结束,且即将开启新一轮跌势。
两阴吃一样形态具有以下特征:
1、第一根蜡烛线应该出现在上升趋势线的顶部,且为长阳线;
2、第二根蜡烛线为阴线,且至少应回落至第一根蜡烛线的中部下方水平
3、第三根蜡烛线需要跌破第一根蜡烛线的低点,以证实卖方力量已经超过之前的买方力量
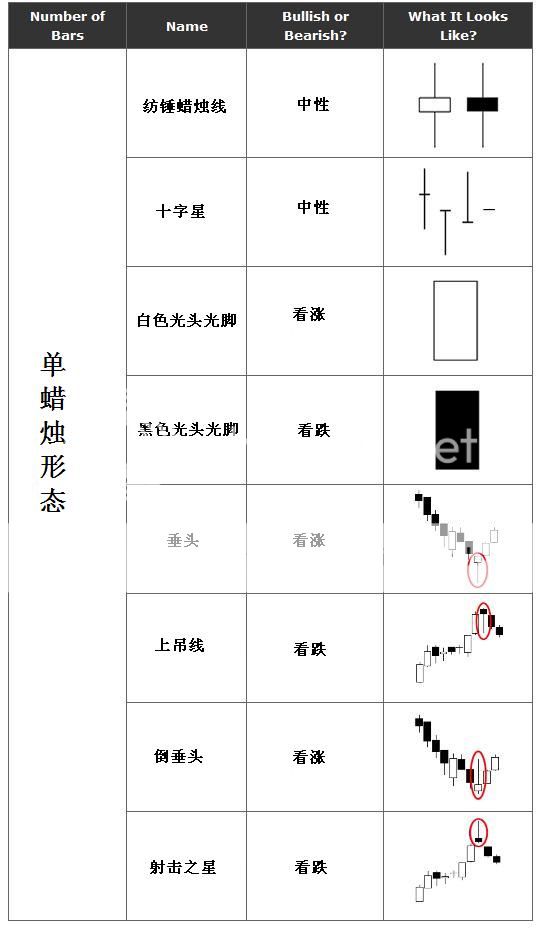
Japanese Candlestick Cheat Sheet
Did you click here first? If you did, stop reading right now and go through the entire Japanese Candlesticks Lesson first!
If you’re REALLY done with those, here’s quick one page reference cheat sheet for single, dual, and triple Japanese candlestick formations to easily identify what kind of pattern you are looking at whenever you are trading.
Go ahead and bookmark this page… No need to be shy!
| Number of Bars | Candlestick Name | Bullish or Bearish? | What It Looks Like? |
|---|---|---|---|
| Single | Spinning Top | Neutral |  |
| Doji | Neutral |  | |
| White Marubozu | Bullish |  | |
| Black Marubozu | Bearish |  | |
| Hammer | Bullish |  | |
| Hanging Man | Bearish |  | |
| Inverted Hammer | Bullish |  | |
| Shooting Star | Bearish |  |
| Number of Bars | Candlestick Name | Bullish or Bearish? | What it Looks Like? |
|---|---|---|---|
| Double | Bullish Engulfing | Bullish |  |
| Bearish Engulfing | Bearish |  | |
| Tweezer Tops | Bearish |  | |
| Tweezer Bottoms | Bullish |  | |
| Triple | Morning Star | Bullish |  |
| Evening Star | Bearish |  | |
| Three White Soldiers | Bullish |  | |
| Three Black Crows | Bearish |  | |
| Three Inside Up | Bullish |  | |
| Three Inside Down | Bearish |  |
Summary of Japanese Candlesticks

- If the close is above the open, then a hollow candlestick (usually displayed as white) is drawn.
- If the close is below the open, then a filled candlestick (usually displayed as black) is drawn.
- The hollow or filled section of the candlestick is called the “real body” or body.
- The thin lines poking above and below the body display the high/low range and are called shadows.
- The top of the upper shadow is the “high”.
- The bottom of the lower shadow is the “low”.
Long bodies indicate strong buying or selling. The longer the body is, the more intense the buying or selling pressure.
Short bodies imply very little buying or selling activity. In street forex lingo, bulls mean buyers and bears mean sellers.
Upper shadows signify the session high.
Lower shadows signify the session low.
There are many types of Japanese candlestick patterns, but they can be categorized into how many bars make up the candlestick pattern. There are single, dual, and triple candlestick formations. The most common types of Japanese candlestick patterns are the following:
| Number of Bars | Japanese Candlestick Pattern |
|---|---|
| Single | Spinning Tops, Dojis, Marubozu, Inverted Hammer, Hanging Man, Shooting Star |
| Double | Bullish and Bearish Engulfing, Tweezer Tops and Bottoms |
| Triple | Morning and Evening Stars, Three Black Crows and Three White Soldiers, Three Inside Up and Down |
Just refer to the Japanese Candlesticks Cheat Sheet for a quick reference on what these candlestick patterns mean.
Combine candlestick analysis with support and resistance levels for best results.
And finally, here are some words of wisdom.
Just because candlesticks hint at a reversal or continuation, it doesn’t mean it will happen for sure! You must always consider market conditions and what price action is telling you.
This is the forex market and nothing is set in stone!
日本蜡烛小抄图解
总结:日本蜡烛线

蜡烛线由一段时间内的开盘价、收盘价、最高价以及最低价绘制而成。
★如果收盘价高于开盘价,则表示为阳线
★如果收盘价低于开盘价,则表示为阴线
★蜡烛线填充部分称为实体
★蜡烛线实体上方和下方的细线称为影线
★上影线的顶部称为高点
★下影线的底部称为低点
实体部位较长意味着买盘或卖盘较强劲。实体部位越长,买盘或卖盘压力越大。
较短的实体意味着买方或卖方活动非常贫乏。
上影线标明了时段高点
下影线标明了时段低点
日本蜡烛线形态众多,但他们能够以蜡烛的根数来划分。分为单蜡烛线形态、双蜡烛线形态和三蜡烛线形态。
下表列举了最为常见的几类蜡烛线形态。

最后,有一些话要牢记:
蜡烛线形态仅仅暗示了可能出现的反转或形态的持续,它并不意味着事情会百分之百发生。你必须时刻考虑到市场的状况以及价格所告诉你的真实情况。
这就是外汇市场,没有什么是一成不变的!