Forex Pivot Points
Are you all excited? It’s your last year in junior high before you head off to high school!
Professional forex traders and market makers use pivot points to identify potential support and resistance levels. Simply put, a pivot point and its support/resistance levels are areas at which the direction of price movement can possibly change.
The reason why pivot points are so enticing?
It’s because they are OBJECTIVE.
Unlike some of the other indicators that we’ve taught you about already, there’s no discretion involved.
In many ways, forex pivot points are very similar to Fibonacci levels. Because so many people are looking at those levels, they almost become self-fulfilling.
The major difference between the two is that with Fibonacci, there is still some subjectivity involved in picking Swing Highs and Swing Lows. With pivot points, forex traders typically use the same method for calculating them.
Many traders keep an eye on these levels and you should too.
Pivot points are especially useful to short-term traders who are looking to take advantage of small price movements. Just like normal support and resistance levels, forex traders can choose to trade the bounce or the break of these levels.
Range-bound traders use pivot points to identify reversal points. They see pivot points as areas where they can place their buy or sell orders.
Breakout forex traders use pivot points to recognize key levels that need to be broken for a move to be classified as a real deal breakout.
Here is an example of pivot points plotted on a 1-hour EUR/USD chart:

As you can see here, horizontal support and resistance levels are placed on your chart. And look – they’re marked out nicely for you! How convenient is that?!
Pivot Point Lingo
Here’s quick rundown on what those acronyms mean:
PP stands for Pivot Point.
S stands for Support.
R stands for Resistance.
But don’t get too caught up in thinking “S1 has to be support” or “R1 has to be resistance.” We’ll explain why later.
In the following lessons, you will learn how to calculate forex pivot points, the different types of pivot points and most importantly, how you can add pivot points to your forex trading toolbox!
外汇轴心点
你觉得兴奋吗?这是你进入高中之前,在初中的最后课程了!
职业交易者和做市商,喜欢使用轴心点来找出,潜在的支撑和阻力水平。简单来说,每一个轴心点 和 它支撑/阻力的水平区域,都会让价格触及后,可能产生反转。
这就是为什么轴心点,如此迷人的原因吗?
这是因为它们是 客观公正 的。
不像我们已经教过你们的其他指标,轴心点不需要经过判断。
在许多方面,斐波那契水平位与轴心点十分相似。因为很多人都盯着这些水平线,所以时常能够自我实现。
轴心点和斐波那契的主要分别是,斐波那契的位置涉及了,分辨波段的最高点和最低点的主观因素。至于轴心点的位置,多数的交易者都是使用同样的方法来计算位置。
许多交易者们留意这些水平位置,所以你也应该这么做。
轴心点对于那些利用,价格小幅波动的短线交易者们,是十分有用的。就像使用一般的支撑和阻力位,交易者们可以在这些位置,当价格突破或反弹时,进行交易。
区间震荡交易者,使用轴心点来确认反转点。他们把轴心点的位置,当成可以设置买单或卖单的地方。
突破交易者,使用轴心点来辨识:真正需要突破的关键位置。当一段价格的移动被确实为趋势的时候。
这是一个1小时欧元/美元的轴心点例子:
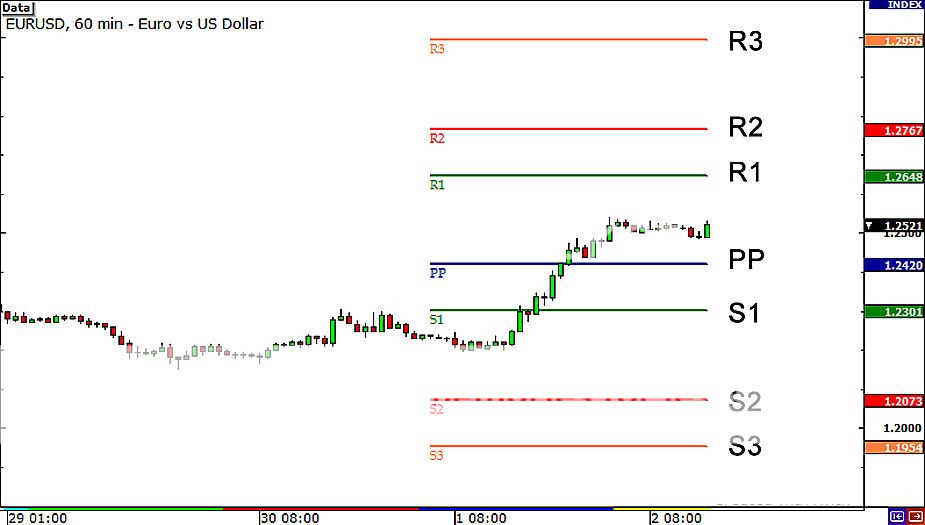
正如你所看到的,水平的支撑和阻力位在你的图表上显示出来。瞧~它们漂亮的为你标示出来了!这是多么的方便啊?!
那些英文首字母的缩写意思是:
PP 代表:轴心点
S 代表:支撑位
R 代表:阻力位
但是不要太陷入“S1一定会支撑着”或“R1一定会阻挡着”的思维当中,我们迟些会解释原因。
在接下来的课程,你将学会如何计算轴心点,各种不同类型和重要性的轴心点,你可以更好的使用交易工具箱里的轴心点。
How to Calculate Pivot Points
The first thing you’re going to learn is how to calculate pivot point levels.
The pivot point and associated support and resistance levels are calculated by using the last trading session’s open, high, low, and close. Since forex is a 24-hour market, most forex traders use the New York closing time of 4:00pm EST as the previous day’s close.
The calculation for a pivot point is shown below:
Pivot point (PP) = (High + Low + Close) / 3
Support and resistance levels are then calculated off the pivot point like so:
First level support and resistance:
First resistance (R1) = (2 x PP) – Low
First support (S1) = (2 x PP) – High
Second level of support and resistance:
Second resistance (R2) = PP + (High – Low)
Second support (S2) = PP – (High – Low)
Third level of support and resistance:
Third resistance (R3) = High + 2(PP – Low)
Third support (S3) = Low – 2(High – PP)
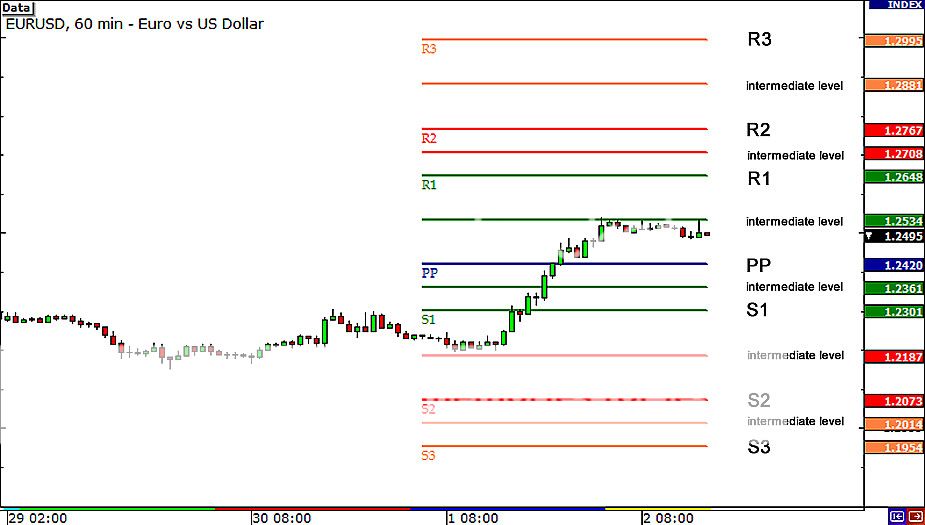
Keep in mind that some forex charting software plot intermediate levels or mid-point levels. These are basically mini levels between the main pivot point and support and resistance levels.

If you hated algebra, have no fear because you don’t have to perform these calculations yourself. Most charting softwares will automatically do this for you. Just make sure you configure your settings so that it uses the correct closing time and price.
We here at BabyPips.com also have our very own Pivot Point Calculator!
The awesome part is, just like everything on the website, it’s FREE!
The forex pivot point calculator can come in handy, especially if you want to do a little back testing to see how pivot point levels have held up in the past. Remember, one of the advantages of using pivot points is that it is objective, so it’s very easy to test how price reacted to them.
Next up, we’ll teach you the various ways in which you can incorporate pivot points into your forex trading strategy.
如何计算轴心点
首先你要学会的,就是如何计算出轴心点的位置。
轴心点与相关的支撑/ 阻力位,都是根据过去时段的开盘价,最高价,最低价和收盘价格来计算的。但是因为外汇是个24小时的市场,所以大多数的交易者们采用纽约收盘时的价位,东部时间下午4:00作为前一天的收盘价。
轴心点的计算方法如下:
轴心点(pp) =(最高价+最低价+收盘价)/3
根据轴心点来计算的支撑位和阻力位:
第一条支撑线和阻力线:
阻力线1(R1) =(2×轴心点)-最低价
支撑线1(S1) =(2×轴心点)-最高价
第二条支撑线和阻力线:
阻力线2(R2)=轴心点+(最高价-最低价)
支撑线2(S2) =轴心点-(最高价-最低价)
第三条支撑线和阻力线:
阻力线2(R3) =最高价+2(轴心点-最低价)
支撑线2(S3) =最低价-2(最高价-轴心点)
你要记的,有些图表的指标可以画出额外的,第四、第五条阻力线和支撑线,还是两条阻力线和支撑线之间的中间线(位于主轴心点与支撑线和阻力线之间)。这些都是在主要的轴心点和主要的支撑/阻力位之间,迷你的支撑/阻力位。
如果你讨厌代数,不需要恐惧,因为你不用亲自计算这些轴心点。大多数软件指标,将会自动为您完成这些事。你只需要确定,指标的设置是正确的收盘时间和价格。
计算机这时候可以派上用场了,特别是如果你希望做一个小小的复盘回测,去查看以前轴心点的作用。记的,使用轴心点的其中一个好处是,它是客观的,所以很容易就能回测复盘,但价格接触到轴心点时的反应。
接下来,我们将会教你各种不同的使用方式,这样你就可以更好的把轴心点,融合进你的交易策略中。
How to use Pivot Points for Range Trading
The simplest way to use pivot point levels in your forex trading is to use them just like your regular support and resistance levels. Just like good ole support and resistance, price will test the levels repeatedly.
The more times a currency pair touches a pivot level then reverses, the stronger the level is. Actually, “pivoting” simply means reaching a support or resistance level and then reversing.
If you see that a pivot level is holding, this could give you some good trading opportunities.
If price is nearing the upper resistance level, you could sell the pair and place a stop just above the resistance.
If price was nearing a support level, you would buy and put your stop just below the level.
See? Just like your regular support and resistance! Nothing hard about that!
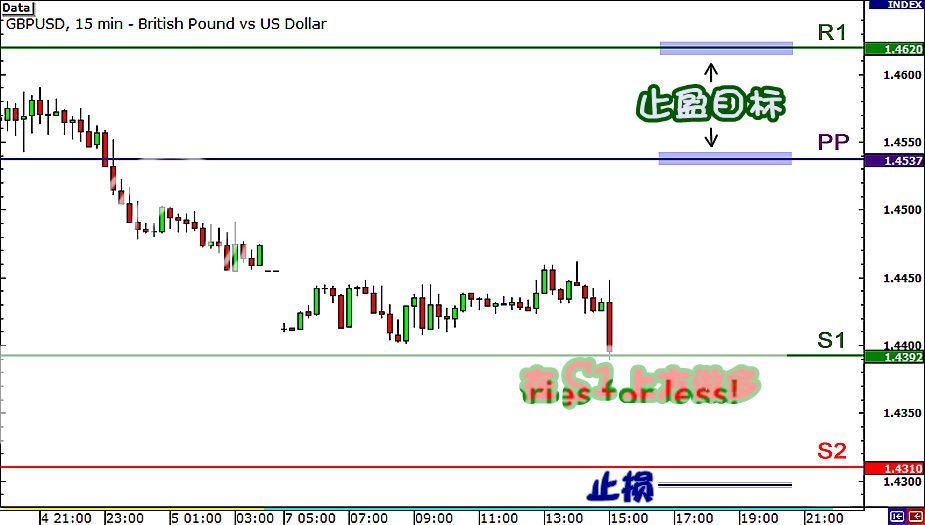
Let’s take a look at an example so you can visualize this. Here’s a 15-minute chart of GBP/USD.

In the chart above, you see that price is testing the S1 support level. If you think it will hold, what you can do is buy at market and then put a stop loss order past the next support level.
If you’re conservative, you can set a wide stop just below S2. If price reaches past S2, chances are it won’t be coming back up, as both S1 and S2 could become resistance levels.
If you’re a little more aggressive and confident that support at S1 would hold, you can set your stop just below S1.
As for your take profit points, you could target PP or R1, which could also provide some sort of resistance. Let’s see what happened if you bought at market.

And bam! Looks like S1 held as support! What’s more, if you had targeted PP as your take profit point, you would have hit your PT! Woohoo! Ice cream and pizza for you!
Of course, it ain’t always that simple. You shouldn’t rely only on the pivot point levels. You should note whether pivot point levels line up with former support and resistance levels.
You can also incorporate candlestick analysis and other types of indicators to help give you more confirmation.
For example, if you see that a doji has formed over S1, or that the stochastic is indicating oversold conditions, then the odds are higher that S1 will hold as support.
Also, most of the time, trading normally takes place between the first support and resistance levels. Occasionally, price will test the second levels and every once in a while, the third levels will be tested.
Lastly, you should also fully understand that sometimes, price will just break through all the levels like how Rafael Nadal breezes through the competition at the French Open.
What will you do when that happens? Continue to hold onto your trade and be a sucker and watch your account dwindle away? Or will you take advantage and get back some pips?
In the next lesson, we’ll teach you how to take advantage when these levels break down.
运用轴心点在
区间交易(震荡)
使用轴心点最简单的方法,就是把它们当成你平时的支撑和阻力位一样的使用。它就好像有效的支撑和阻力位,价格会重复的测试这些位置。
当货币对多次触及轴心点的某个关键位置且被反弹,则这位置的强度越高。其实,“轴心”简单的说就是价格达到某支撑或阻力线后,就会开始旋转然后反转。
如果你注意到某一个轴心点已经生效,它将可以给你一些不错的交易机会。
如果价格上涨接近阻力位,你可以下些空单,并在阻力位上方设置止损单。
如果价格已跌接近支撑位,你可以下些多单,并在支撑位下方设置止损单。
看到了吗?就像你平时使用支撑和阻力位一样!没有什么难度的!
让我们再来看看一个例子,这样你就可以意会了。这是个英镑/美元15分钟的图表。
在上图中,你看价格正在测试S1的支撑位。如果你认为S1可以让价格反弹,那你可以做的就是进场做多,然后在下个支撑位的附近设置止损。
如果你是比较保守的,你可以在低于S2设置一个较宽的止损。如果价格跌破S2,哪它很可能意味着不会再上涨了,所以S1和S2都可能转为阻力位。
如果你是比较积极和自信,相信S1可以支撑住,你也可以把止损单设置在S1的下方。
至于你的获利的目标,你可以把止盈定在PP或是R1,它们代表着不同程度的阻力。让我们来看看,如果你已经下了多单会这样?
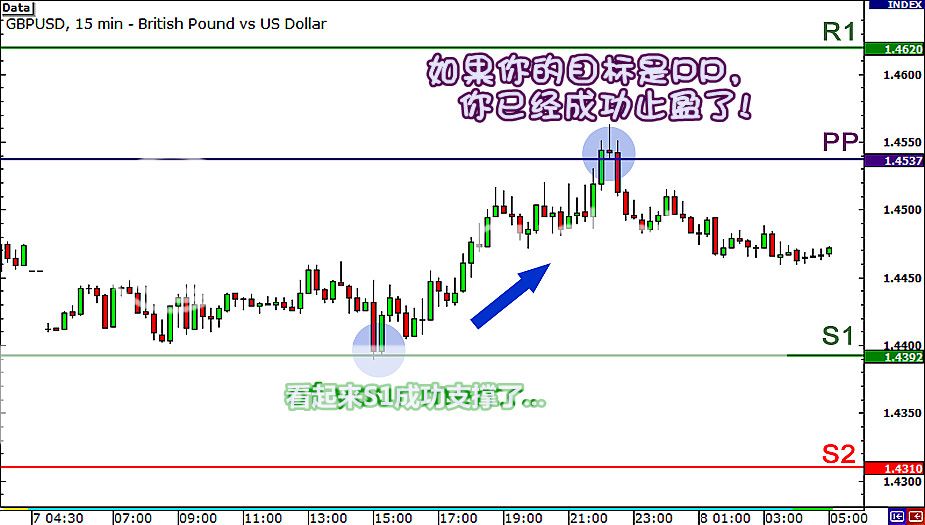
接着一下子!看起来S1的支撑是起到了作用!更重要的是,如果你的止盈目标是PP,你已经达到了你的目标。Woohoo! 冰欺凌和披萨将为你服务。
当然,它不会一直是那么简单。你不应该只是单靠轴心点就开始交易。你应该要先查看轴心点的位置,是否和之前的其他支撑和阻力位重叠。
你也可以配合蜡烛图来分析,或其他类型的指标来帮助你,获得更多的确认。
例如:如果你看到一个十字星在S1形成,或者随机震荡指标已经显示了超卖,这样S1会造成价格反弹的概率就会比较高。
还有,虽然大部分的时候,价格通常在第一个支撑和阻力位之间波动。但是偶尔的,价格会每隔一段时间就测试第二位置,或是第三位置。
最后,你应该也完全了解,有时候价格可能会完全突破所有的支撑/阻力位,就像网球天王Roger Federer在Wimbledon的网球公开赛上一帆风顺一样。
如果价格突破了你的所有支撑/阻力位,你会做什么?继续持有你的仓位,像个笨蛋衰仔一样,看着你账户的钱逐渐减少?还是你会利用这趋势,趁机赚回一些点数?
在接下来的课程中,我们会教你当这些支撑/阻力位都被突破时,该如何趁势交易。
How to use Pivot Points to Trade Breakouts
Just like your normal support and resistance levels, pivot point levels won’t hold forever.
Using pivot points for range trading will work, but not all the time. In those times that these levels fail to hold, you should have some tools ready in your forex toolbox to take advantage of the situation!
As we showed you earlier, there are two main ways to trade breakouts: the aggressive way or the safe way.
Either method will work just fine. Just always remember that if you take the safe way, which means waiting for a retest of support or resistance, you may miss out on the initial move.
Using Pivot Points to Trade Potential Breakouts
Let’s take a look at a chart to see potential breakout trades using pivot points. Below is a 15-minute chart of EUR/USD.

Here we see EUR/USD made a strong rally throughout the day. We see that EUR/USD opened by gapping up above the pivot point. Price made a strong move up, before pausing slightly at R1.
Eventually, resistance broke and the pair jumped up by 50 pips!
If you had taken the aggressive method, you would have caught the initial move and been celebrating like you just won the World Cup.
On the other hand, if you had taken the safe way and waited for a retest, you would have been one sad little trader. The price did not retest after breaking R1. In fact, the same thing happened for both R1 and R2!
Notice how EUR/USD bulls tried to make a run for R3 as well.
However, if you had taken the aggressive method, you would have gotten caught up in a fake out as the price failed to sustain the initial break. If your stop was too tight, then you would have gotten stopped out.
Later on though, you’ll see that the price eventually broke through. Notice how there was also a retest of the broken resistance line.
Also, observe how when the pair reversed later in the day and broke down past R3. There was an opportunity to take a short on the retest of resistance-turned support – turned resistance (read that again if you have to!).
Remember that, when support levels break, they usually turn into resistance levels.
This concept of “role reversal” also applies for broken resistance levels which become support levels. These would have been good opportunities to take the “I think I’ll play it safe” method.
Where do you place stops and pick targets with breakouts?
One of the difficult things about taking breakout trades is picking a spot to place your stop. Unlike range trading where you are looking for breaks of pivot point support and resistance levels, you are looking for strong fast moves.
Once a level breaks, in theory, that level will likely become “support-turned-resistance” or “resistance-turned-support.” Again, this is called a role reversal…since the roles have been reversed.
If you were going long and price broke R1, you could place your stop just below R1.
Let’s go back to that EUR/USD chart to see where you could place your stops.
As for setting targets, you would typically aim for the next pivot point support or resistance level as your take profit point. It’s very rare that price will break past all the pivot point levels, unless a big economic event or surprise news comes out.
Let’s go back to that EUR/USD chart to see where you would put those stops and take profit.

In this example, once you saw price break R1, you would have set your stop just below R1. If you believed that price would continue to rise, you could keep your position and move your stop manually to see if move would continue. You’d have to watch carefully and adjust accordingly. You’ll learn more about this in later lessons.
As with any method or indicator, you have to be aware of the risks with taking breakout trades.
First of all, you have no idea whether or not the move will continue. You might enter thinking that price will continue to rise, but instead you catch a top or bottom, which means that you’ve been faked out!
Second, you won’t be sure if it’s a true breakout, or just wild moves caused by the release of important news. Spikes in volatility are a common occurrence during news events, so be sure to keep up with breaking news and be aware of what’s on the forex calendar for the day or week.
Lastly, just like in range trading, it would be best to pop on other key support and resistance levels. You might be thinking that R1 is breaking, but you failed to notice a strong resistance level just past R1. Price may break past R1, test the resistance and just fall back down.
You should make use of your forex knowledge of support and resistance, candlestick patterns, and momentum indicators to help you give stronger signals as to whether the break is for real or not.
运用轴心点在突破交易
就像你传统的支撑和阻力位一样,轴心点的支撑/阻力位也不会永远有效。
区间交易时,运用轴心点是有效果的,但并不是所有的时候都有效。当另一时候,这些支撑/阻力位都失效时,你应该已经准备好一些策略,来利用这个机会。
就像我们之前示范给你的,价格突破时有两种主要的下单方法:积极的方法或安全的方法。
这两种下单的方法,表现都不错。只需要永远记得,如果你采取安全的方法,这意味着需要等待价格,再次的测试支撑或阻力位后才下单。这样你可能会错过,最初的丰厚获利机会。
让我们来看看一个图表,如何使用轴心点来寻找潜在的突破交易。下面是一个欧元/美元15分钟的图表。
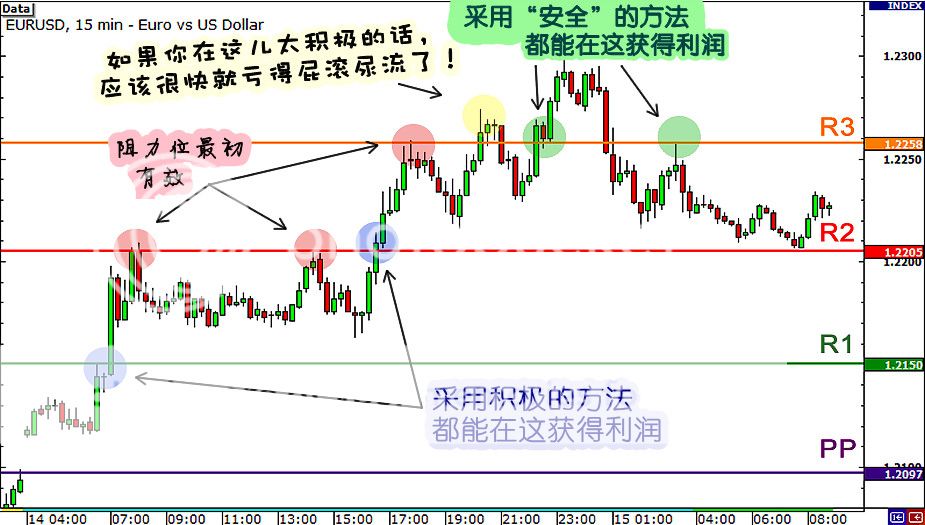
在这里,我们看到欧元/美元强劲上涨了一整天。我们可以发现到欧元/美元一开市向上跳空超过了轴心点上面。价格强劲上涨,升到R1的位置才稍微的停顿。
最后,阻力位被突破,货币对跳升了约50点。
如果你采取了积极的下单方法,你应该抓到了刚开始的价格移动,并且就像你刚赢得了美国橄榄球超级杯一样的在庆祝。
另外一边,如果你采取了较安全的下单方法,需等待价格回测R1后才下单,那你已经成为个愁眉苦脸的交易者。因为价格在突破R1之后并没有回测。其实,价格在突破R2之后,也并没有回测。
这时注意欧元/美元的公牛们是怎样逐渐的冲破R3的。
所以,如果你这时采取了积极的下单方法,你会在价格刚开始突破R3失败时,抓到一个假突破。如果你的止损设得太紧,那么你的单子应该都被停损了。
随后,你就会发现价格最终都跌破R3了。注意价格在突破R3的阻力位后,曾出现一个回测。
同时,观察欧元/美元在日内稍晚,是如何反转并跌破R3的。当阻力位-转为-支撑位-再转为-阻力后(读多一遍,如果你看不懂的话!),的回测是个做空的最佳机会。
还记得吗,当支撑位被突破后,它们通常转变成阻力位。
这个“角色转换”的概念,同样适用于支撑位转成阻力位后,再转成支撑位。这些都是很好的“我要等到非常安全时才下单”的交易机会。
如何在突破交易中,设置止损和止盈。
使用突破交易的困难之一,就是止损位置的设置。它不同于区间交易的时候,在区间交易时,你只需要把止损设置在轴心点的支撑或阻力位后面。而突破交易时,你需要寻找到强劲的波动。
一旦某个水平位被突破,从理论上说,这水平位就有可能成为”支撑位-转-阻力位” 或是 “阻力位-转-支撑位”。
如果你正在做多,当价格升破R1水平位时,你可以把你的止损,设置在R1水平位的下方。
对于设置的止盈目标,你通常应该是瞄准在,下一个轴心点的水平位上。价格要突破所有的轴心点水平位,是非常罕见的。除非市场出现重大的经济事情,或是突发新闻的发布。
让我们回到欧元/美元的图表,来看看你应该在什么位置,设置止损和止盈。
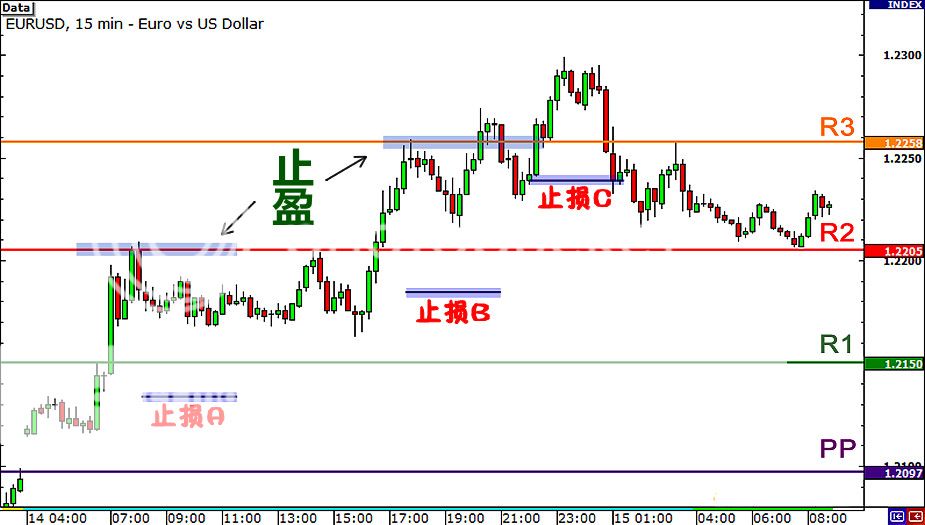
在这个例子中,一旦你看到价格突破R1,你可以把你的止损设置在R1下方。如果你相信价格将继续上升,你可以继续持有你的头寸,并随着价格的上升,手动的移动你的止损位。你将需要密切的注意价格波动,并做出相应的调整。你会在下一课的内容中,学到更多这方面的知识。
和其他的交易方法或指标一样,当你使用轴心点来进行突破交易时,你必须对风险非常的小心。
首先,你完全不知道价格是否会继续下去。你可能会认为价格将会继续上升,结果你抓到了一个顶部或是底部,这意味着你已经被骗得头昏脑花了!
第二,你不知道这个价格突破的真实性,可能只是因为发布新闻数据,所造成的狂野波动。在新闻事件中,价格出现激烈的波动,是很平常的情况。所以一定注意突发性的新闻,和小心外汇日历上,公布的经济数据。
最后,就像在区间交易一样,突破交易最好是结合其他的,关键支撑和阻力位一起使用。你可能会认为价格已经完全突破R1,但你却没有注意到有另一种很强的阻力位在R1上方。结果价格在突破R1后、测试了该上方的另一种阻力位后,就跌回下方接续滑落。
你应该好好利用你的所有知识,像支撑/阻力位、蜡烛形态,和动能指标等等,来帮助你判断该价格的突破,是否真实。
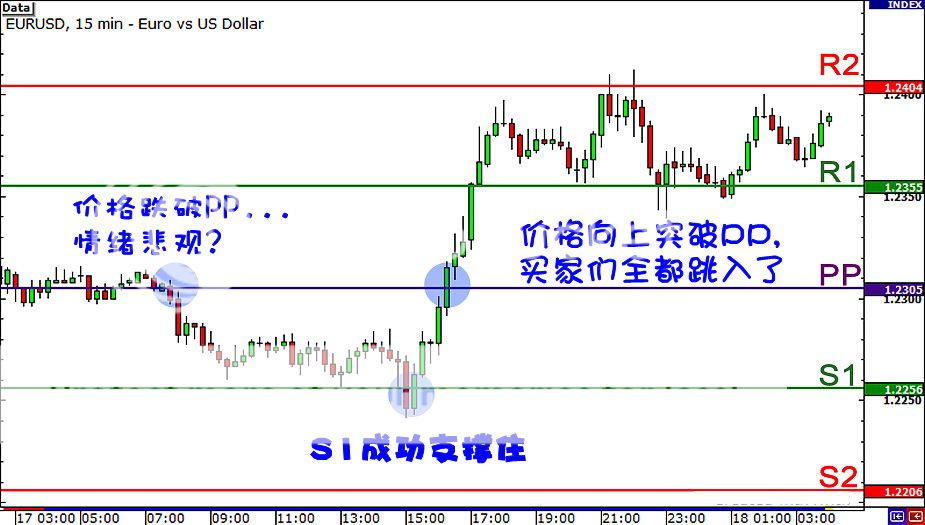
How to Use Pivot Points to Measure Market Sentiment
There is one other way to incorporate pivot points into your forex trading strategy, and that’s to use it to gauge market sentiment.
What this means is that you can tell whether traders are more inclined to buy or sell the pair. All you would need to do is to keep an eye on the pivot point. You could treat it like the 50 yard line of a football field. Depending on which side the ball (in this case, price) is on, you can tell whether buyers or sellers have the upper hand.
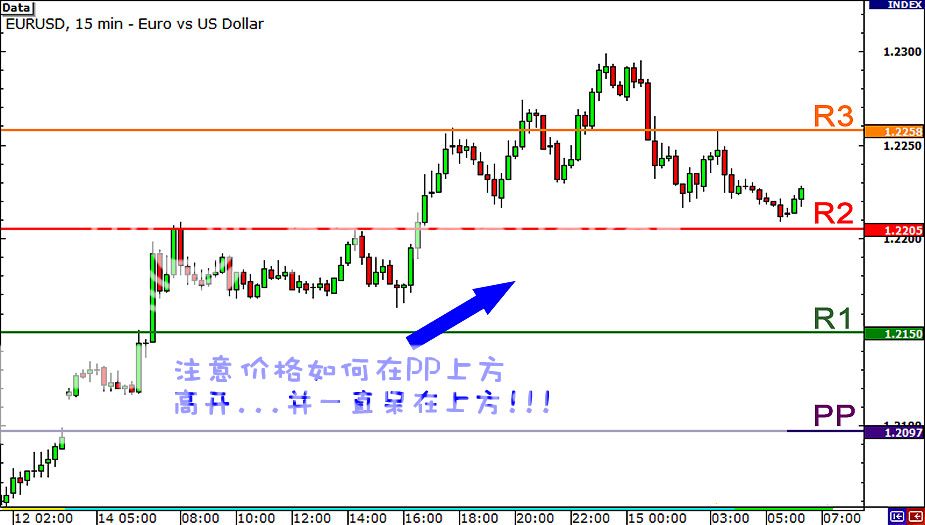
If the price breaks through the pivot point to the top, it’s a sign that traders are bullish on the pair and you should start buying the pair like it’s a Krispy Kreme donut. Here’s an example of what happened when the price stayed above the pivot point.

In this example, we see that EUR/USD gapped up and opened above the pivot point. The price then rose higher and higher, breaking through all the resistance levels.
Now, if price breaks through the pivot point to the bottom, then you should start selling the pair like it’s Enron stock. The price being below the pivot point would signal bearish sentiment and that sellers could have the upper hand for the trading session.
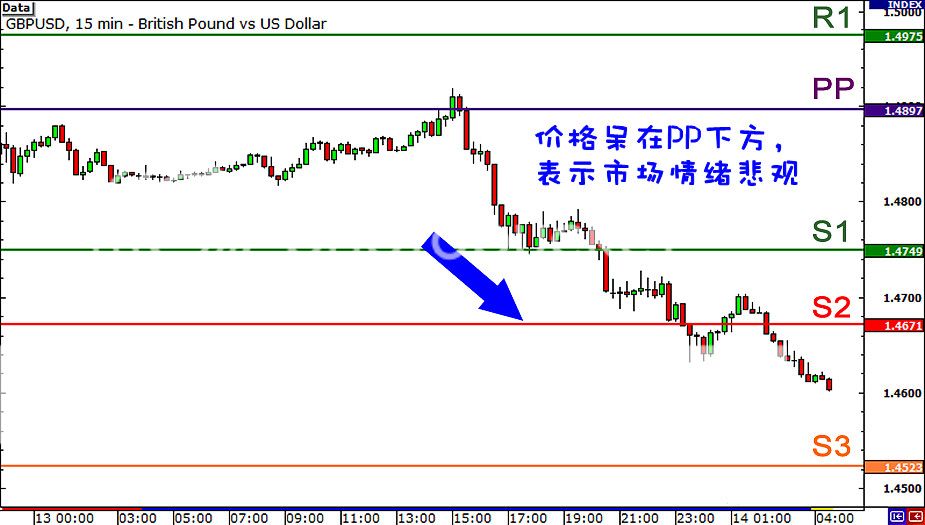
Let’s take a look at a chart of GBP/USD.

In the chart above, we see that the price tested the pivot point, which held as a resistance level. Next thing you know, the pair keeps going lower and lower. If you had taken the clue that price remained below the pivot point and sold the pair, you would have made some nice moolah. GBP/USD dropped almost 300 pips!
Of course, it doesn’t always work out like this. There are times when you think that forex traders are bearish on a pair, only to see that the pair reverses and breaks through to the top!

In this example, if you saw price breaking lower from the pivot point and sold, you would have had a sad, sad day. Later on during the European session, EUR/USD popped higher, eventually breaking through the pivot point. What’s more, the pair stayed above the pivot point, showing how buyers were rockin’ away.
The lesson here?
Traders are fickle!
How forex traders feel about a currency can shift dramatically day to day, even session to session. This is why you cannot simply buy when price is above the pivot point or sell when it is below it.
Instead, if you choose to use pivot point analysis in this way, you should combine it with other indicators to help you determine overall market sentiment.
使用轴心点来判断市场情绪
这里还有另外一种轴心点的使用方法,可以结合进你的交易策略里,就是使用它来评估 市场的情绪。
这意味着你可以知道,交易者们是更倾向于买进还是卖出这货币对。你唯一需要做的,就是睁大眼睛注意着轴心点。你也可以把它当成美式足球球场中央的50码线。通过判断橄榄球(在这里,就是指价格)在球场的位置,你可以知道是买家们还是卖家们,谁占了上风。
如果价格突破轴心点向上升,这意味着交易者们都乐观看好该货币对,你应该就像在Krispy Kreme的甜甜圈连锁店前,抢购脆奶油donut的情形,开始买进这货币对。下面是一个例子,关于价格呆在轴心点上方的情形。
在这个例子中,我们看到欧元/美元向上跳空,并在轴心点的上方高开。价格之后越涨越高,并打破了所有的阻力位。
现在,如果价格跌破枢轴点的下方,那么你应该开始卖出这一货币对,就像是卖出闻名的诈骗公司Enron的股票一样。当价格低于枢轴点时,意味着市场充斥着悲观情绪,而卖方在交易时段能可能会占得上风。
让我们来看看一个关于英镑/美元的图表
在上图中,我们看到价格在开始时,测试了枢心点PP的位置,枢心点就像阻力位一样阻挡了趋势。接下来情况你已经知道,价格一直低迷。如果你已经掌握了线索,发现价格一直低于枢轴点,你就该卖出这货币对,这样你就可以获得一些漂亮的钞票。英镑/美元下跌了约300点。
当然,这个方法并不是每次都有效的。有时候当你 想了解交易者们是否做空该货币对时,你只需要看一看那货币对是否开始反转,还是开始向上突破价位。
在这个例子中,假设一开始你注意到价格一直低于枢心点,所以你开始卖出,结果你得到了一个很伤心、非常伤心的一天。因为在不久的欧洲交易时段,欧元/美元突然弹得很高,最终向上突破了枢心点。更重要的是,该货币对之后就一直呆在枢心点上方,这就表明了交易者们的情绪,已经从悲观的突然转成快乐得在摇滚了。
这里的教训是什么呢?
交易者们的情绪是善变的!
交易者们对于一种货币的感觉,可以在每天、甚至是每个时段,喜剧化的改变。这就是为什么你不能简单的,在价格高于枢心点时买进;或是在价格低于枢心点时卖出。
相反,如果你选择使用枢心点来进行情绪分析,那你应该把它结合其他的指标,来帮助你判断整个市场的情绪反应。
Know the 3 Other Types of Pivot Points
While we suggest that you stick to the standard method of calculating pivot points, you should know that there are other ways to calculate for pivot points. In this lesson, we will talk about these other methods, as well as give you the formulas on how to calculate for these levels.
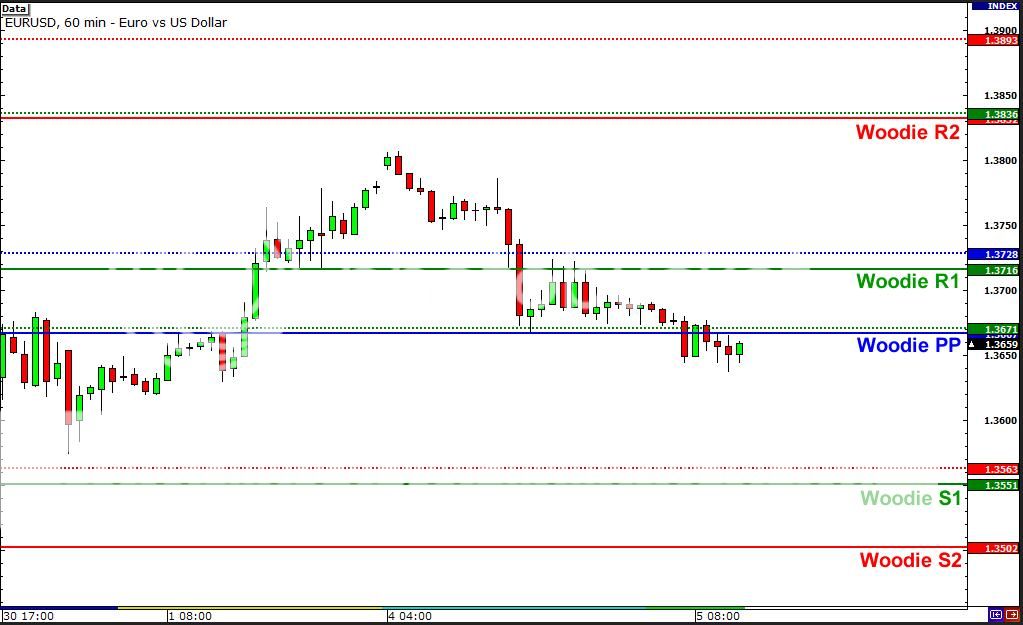
Woodie Pivot Point
R2 = PP + High – Low
R1 = (2 X PP) – Low
PP = (H + L + 2C) / 4
S1 = (2 X PP) – High
S2 = PP – High + Low
C – Closing Price, H – High, L – Low
In the formulas above, you’ll notice that the pivot point calculation is very different from the standard method.
Also, in order the calculate for the corresponding support and resistance levels, you would use the difference between the previous day’s high and low, otherwise known as the range.
Here’s a chart example of the Woodie pivot point calculation applied on EURUSD. The Woodie pivot point, support levels, and resistance levels are the solid lines while the dotted lines represent the levels calculated through the standard method.

Because they have different formulas, levels obtained through the Woodie calculations are very different from those gotten through the standard method.
Some traders prefer to use the Woodie formulas because they give more weight to the closing price of the previous period. Others prefer the standard formulas because many traders make use of those, which could make them self-fulfilling.
In any case, since resistance turns into support (and vice versa), if you choose to use the Woodie formulas, you should keep an eye on these levels as they could become areas of interest. Whatever floats your boat!
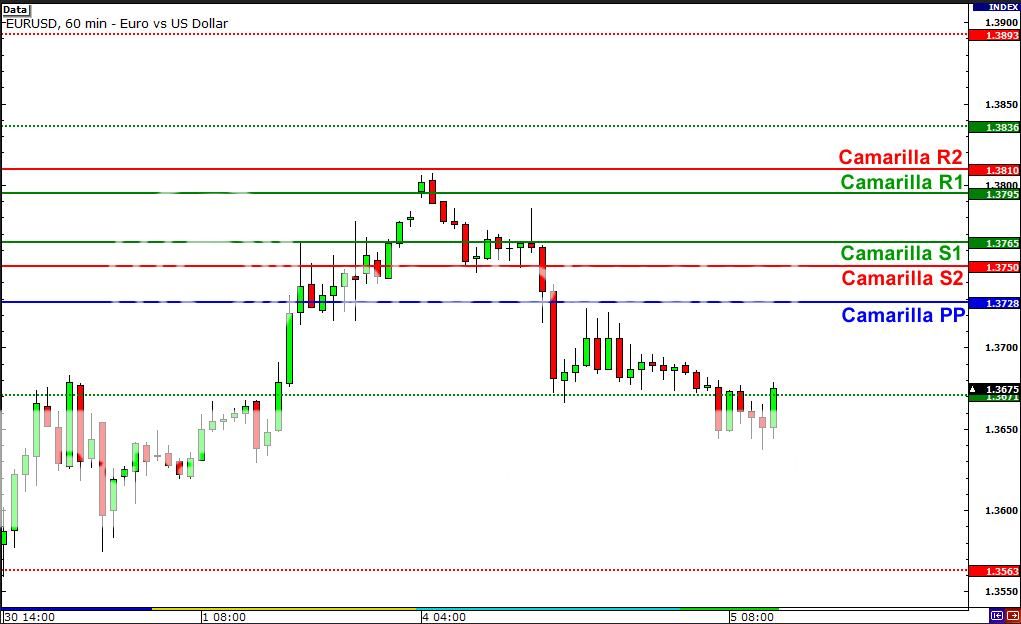
Camarilla Pivot Point
R4 = C + ((H-L) x 1.5000)
R3 = C + ((H-L) x 1.2500)
R2 = C + ((H-L) x 1.1666)
R1 = C + ((H-L) x 1.0833)
PP = (H + L + C) / 3
S1 = C – ((H-L) x 1.0833)
S2 = C – ((H-L) x 1.1666)
S3 = C – ((H-L) x 1.2500)
S4 = C – ((H-L) x 1.5000)
C – Closing Price, H – High, L – Low
The Camarilla formulas are similar to the Woodie formula. They also use the previous day’s close and range to calculate the support and resistance levels.
The only difference is that you should calculate for 8 major levels (4 resistance and 4 support), and each of these levels should be multiplied by a multiplier.
The main concept of Camarilla pivot points is that it is based on the idea that price has a natural tendency to revert back to the mean (sound familiar?), or in this case, the previous day’s close.
The idea is that you should buy or sell when price reaches either the third support or resistance level. However, if price were to burst through S4 or R4, it would mean that the intraday trend is strong, and it’s about time you jump on that bandwagon!
Check out how the Camarilla calculation gives different levels (solid lines) compared to the standard method’s levels (dotted lines)!

As you can see from the chart above, more emphasis is given to the closing price as opposed to the pivot point. Because of this, it’s possible that resistance levels could be below the pivot point or support levels could be above it.
See how all the support and resistance levels are above the Camarilla pivot point?
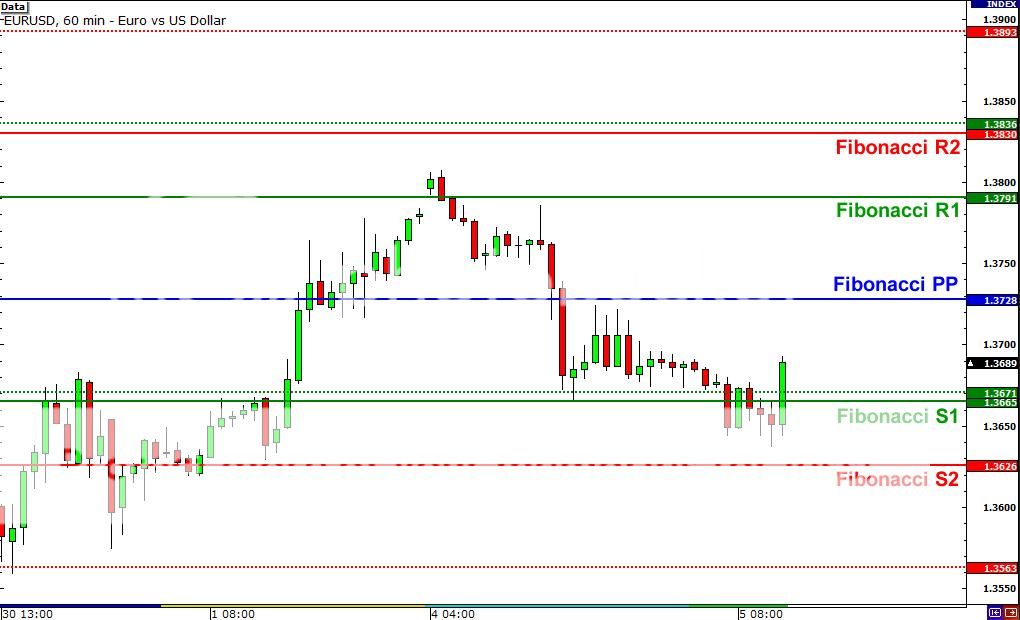
Fibonacci Pivot Point
R3 = PP + ((High – Low) x 1.000)
R2 = PP + ((High – Low) x .618)
R1 = PP + ((High – Low) x .382)
PP = (H + L + C) / 3
S1 = PP – ((High – Low) x .382)
S2 = PP – ((High – Low) x .618)
S3 = PP – ((High – Low) x 1.000)
C – Closing Price, H – High, L – Low
Fibonacci pivot point levels are determined by first calculating the pivot point like you would the standard method.
Next, multiply the previous day’s range with its corresponding Fibonacci level. Most traders use the 38.2%, 61.8% and 100% retracements in their calculations.
Finally, add or subtract the figures you get to the pivot point and voila, you’ve got your Fibonacci pivot point levels!
Look at the chart below to see how the levels calculated through the Fibonacci method (solid lines) differ from those calculated through the standard method (dotted lines).

The logic behind this is that many traders like using the Fibonacci ratios. People use it for retracement levels, moving averages, etc.
Why not use it for pivot points as well?
Remember that both Fibonacci and pivot points levels are used to find support and resistance. With so many traders looking at these levels, they can actually become self-fulfilling.
Which pivot point method is best?
The truth is, just like all the variations of all the other indicators that you’ve learned so far, there is no single best method. It really all depends on how you combine your knowledge of pivot points with all the other tools in your forex trading toolbox.
Just know that most charting software that do automatic calculations normally use the standard method in calculating for the pivot point levels.
But now that you know how to calculate for these levels on your own, you can give them all a swing and see which one works best for you. Pivot away!
其它3种枢纽点的计算方法
虽然我们建议你采用标准的枢纽点计算方法,但是,你也应该知道其它计算枢纽点的方法。在本课中,我们将讨论枢纽点的其它计算方法,并告诉你如何计算这些价位。
伍迪枢纽点
R2 = PP + High – Low
R1 = (2 X PP) – Low
PP = (H + L + 2C) / 4
S1 = (2 X PP) – High
S2 = PP – High + Low
C-Closing Price(收盘价),H-High(最高价),L-Low(最低价)
从上面的公式我们可以发现,伍迪枢纽点的计算和标准枢纽点的计算方法非常不同。
同时,为了计算相应的支撑和阻力位,你也应该用到前一个交易时段最高价和最低价之差,即我们所知的交易区间。
下图是伍迪枢纽点运用于欧元/美元中的例子。伍迪枢纽点、阻力位以及支撑位都是稳定的水平线,而图中的虚线则是用标准枢纽点方法计算出的水平位。
由于它们的计算方法不同,通过伍迪方法计算的枢纽点水平和通过标准方法计算的枢纽点位非常的不同。
一些交易者倾向于使用伍迪公式,因为它给予前一个交易时段收盘价的权重更大。另一些交易者则喜欢标准公式,因为有更多的交易者使用它,这也可能使得标准枢纽点位成为自我实现的寓言。
不管怎样,鉴于阻力可能变为支撑(反之亦然),如果你选择使用伍迪公式,你应该关注这些阻力转支撑或支撑转阻力位,因为它们可能变为非常重要的区域。
卡玛利拉枢轴点
R4 = C + ((H-L) x 1.5000)
R3 = C + ((H-L) x 1.2500)
R2 = C + ((H-L) x 1.1666)
R1 = C + ((H-L) x 1.0833)
PP = (H + L + C) / 3
S1 = C – ((H-L) x 1.0833)
S2 = C – ((H-L) x 1.1666)
S3 = C – ((H-L) x 1.2500)
S4 = C – ((H-L) x 1.5000)
C-Closing Price(收盘价),H-High(最高价),L-Low(最低价)
卡玛利拉枢纽点和伍迪枢纽点非常类似。它也使用前一交易时段的收盘价和最高价以及最低价来计算支撑位和阻力位。
唯一的不同在于,你应该计算8条主要的水平位(4条阻力位和4条支撑位),而且每条水平位都是通过和具体的乘数相乘得出。
卡玛利拉枢纽点的主要理念基于这一观点,即价格倾向于回归至前一交易时段的收盘水平。
这意味着,当回家达到第三条阻力线或支撑线时,你应该卖出或买入。不过,如果价格突破S4或R4,则意味着日内趋势非常强劲,而你也应该放弃先前的想法。
现在让我们看看,通过卡玛利拉计算方法和标准方法计算出的枢纽点位的不同吧,图中虚线为通过标准方法计算的枢纽点水平位。
如上图所示,和标准枢纽点不同,收盘价权重在卡玛利拉枢纽点的计算中占有更大比例,有鉴于此,卡玛利拉枢纽点阻力位可能低于枢纽点水平,或支撑位可能高于枢纽点水平。
看看,在本例中,阻力位和支撑位水平都在卡玛利拉枢纽点的上方。
斐波那契枢纽点
R3 = PP + ((High – Low) x 1.000)
R2 = PP + ((High – Low) x .618)
R1 = PP + ((High – Low) x .382)
PP = (H + L + C) / 3
S1 = PP – ((High – Low) x .382)
S2 = PP – ((High – Low) x .618)
S3 = PP – ((High – Low) x 1.000)
C-Closing Price(收盘价),H-High(最高价),L-Low(最低价)
斐波那契枢纽点PP的计算和标准枢纽点PP的计算方法一样。不同的地方在于支撑位和阻力位的计算。
下一步,我们将前一个交易区间的具体数值(最高价减去最低价)和相应的斐波那契水平相乘。绝大多数交易者利用38.2%、61.8%以及100%的回撤位作为乘数。
最后,将PP和你之前计算的数值相加或相减,即得到具体的阻力位或支撑位。好了,我们已经得到了斐波那契枢纽点位。
如下图所示,让我们看看,斐波那契枢纽点位和标准枢纽点位(图中虚线)有何不同。
使用斐波那契枢纽点的逻辑在于,多数交易者喜欢使用斐波那契比率。人们在回撤位、移动均线等众多指标中都在使用斐波那契比率。
所以,为什么不能将斐波那契利率运用到枢纽点计算中呢?
我们要记住的是,斐波那契和枢纽点都是用来寻找支撑位和阻力位的。由于众多的交易者都在关注着这些价位,因此它们能够变为自我实现的寓言。
那种方法更好?
事实是,和你截至目前所学习到的其他指标的所有变体一样,没有哪一种是做好的方法。这完全取决于如何将你学到的枢纽点知识和你的所掌握的其他交易工具的结合使用。
我们要知道,绝大多数外汇交易图形软件都会自动计算标准枢纽点水平位。
但是,鉴于我们已经知道了计算这些枢纽点位的防范,我们能够将他们一并画在我们的图形上,来比较哪种方法计算出的枢纽点最适合我们的交易。
Summary Of Pivot Points

Here are some easy-to-memorize tips that will help you to make smart pivot point trading decisions:
- Pivot points are a technique used by forex traders to help determine potential support and resistance areas.
- There are four main ways to calculate for pivot points: Standard, Woodie, Camarilla, and Fibonacci.
- Pivots can be extremely useful in forex since many currency pairs usually fluctuate between these levels. Most of the time, price ranges between R1 and S1.
- Pivot points can be used by range, breakout, and trend traders.
- Range-bound forex traders will enter a buy order near identified levels of support and a sell order when the pair nears resistance.
- Pivot points also allow breakout forex traders to identify key levels that need to be broken for a move to qualify as a strong momentum move.
- Sentiment (or trend) forex traders use pivot points to help determine the bullishness or bearishness of a currency pair.
- The simplicity of pivot points definitely makes them a useful tool to add to your trading toolbox. It allows you to see possible areas that are likely to cause price movement. You’ll become more in sync to market movements and make better trading decisions.
- Using pivot point analysis alone is not always enough. Learn to use pivot points along with other technical analysis tools such as candlestick patterns, MACD crossover, moving averages crossovers, the stochastic, RSI, etc. The greater the confirmation, the greater your probability of a successful trade!
总结:枢心点

我们这里有一些简单易记的小技巧,它们有利于你做出精明的枢纽点交易决策。
● 枢纽点是交易者用来确定潜在的支撑和阻力位的技术工具。
● 有四种计算枢纽点的方法:标准计算方法、伍迪计算方法、卡玛利拉计算方法和斐波那契计算方法。
● 在外汇交易中,枢纽点的计算极其有用,因为绝大多数货币对通常维持在这些水平位之间波动。
绝大多数时候,汇价维持在R1和S1之间。
● 枢纽点能够用来进行区间交易、突破行情交易以及趋势交易。
● 区间交易者将在汇价接近已经确定的支撑位附近水平买入,并在汇价接近阻力位时卖出。
● 突破行情交易者也可以利用枢纽点来鉴别关键突破位,汇价在突破这一价位后可能出现强劲突破行情走势。
● 情绪或趋势交易者利用枢纽点以帮他们确定某一货币对是处于牛市或熊市。
● 枢纽点的简易性使得我们能够很方便的将它们放入我们的外汇交易工具箱里面。
我们只需要关注可能引发价格走势波动的可能价格趋于即可。借用枢纽点,
你在确定市场波动并作出更完美交易策略方面将变得更加得心应手。
● 仅仅利用枢纽点来指导我们的交易远远不够。我们需要学会将枢纽点和其他技术分析工具结合使用,
比如蜡烛形态、MACD交叉、移动均线交叉、RSI指标等。这有利于我们提高我们的交易胜算。