Forex Market Sentiment
How’s Mr. Market Feeling?
Every forex trader will always have an opinion about the market.
“It’s a bear market, everything is going to hell!”
“Things are looking bright. I’m pretty bullish on the markets right now.”

Each and every trader will have their own personal explanation as to why the market is moving a certain way.
When trading, traders express this view in whatever trade he takes. But sometimes, no matter how convinced a trader is that the markets will move in a particular direction, and no matter how pretty all the trend lines line up, the trader may still end up losing.
A forex trader must realize that the overall market is a combination of all the views, ideas and opinions of all the participants in the market. That’s right… EVERYONE.
This combined feeling that market participants have is what we call market sentiment.
It is the dominating emotion or idea that the majority of the market feels best explains the current direction of the market.
How to Develop a Market Sentiment-Based Approach
As a forex trader, it is your job to gauge what the market is feeling. Are the indicators pointing towards bullish conditions? Are traders bearish on the economy? We can’t tell the market what we think it should do. But what we can do is react in response to what is happening in the markets.
Note that using the market sentiment approach doesn’t give a precise entry and exit for each trade. But don’t despair! Having a sentiment-based approach can help you decide whether you should go with the flow or not. Of course, you can always combine market sentiment analysis with technical and fundamental analysis to come up with better trade ideas.
In stocks and options, traders can look at volume traded as an indicator of sentiment. If a stock price has been rising, but volume is declining, it may signal that the market is overbought. Or if a declining stock suddenly reversed on high volume, it means the market sentiment may have changed from bearish to bullish.
Unfortunately, since the forex market is traded over-the-counter, it doesn’t have a centralized market. This means that the volume of each currency traded cannot be easily measured.

GASP!
OH NOOOO!!!!
Without any tools to measure volume, how can a forex trader measure market sentiment?!
This is where the Commitment of Traders report comes in!
什么是市场情绪
市场先生感觉如何?
每一名交易者对市场都会有他们自己的看法。
“市场处于熊市,市场都太糟了!”
“看上去一切都很明朗,现在市场正处于牛市中。”
.jpg)
每一名交易者都会以他们从他们自己的角度来解释,为什么市场正以某一特定方式运行。
当进行交易时,交易者都会对他们进行的交易发表他们各自的观点。但是有些时候,无论交易者是多么的确信市场,市场将会沿着某一特定方向运行,他们的交易都有可能最终以失败而告终。
交易者必须认识到,整体市场是所有市场参与人士观点的综合展现。是的,所有市场参与者。
这种所有市场参与者共同表现出来的感觉,即我们所说的市场情绪。
也正是市场上大多数参与者的主流观点决定了当前市场的总体方向。
如何进行市场情绪分析
作为一名交易者,对市场情绪的分析可是你交易工作中不可或缺的一环。经济指标显示市场将会上涨吗?交易者们对经济的看法悲观吗?我们不能告诉市场,应该以我们认为的形势发展。我们所能做的是,对市场上正在发生的事情做出反应。
需要注意的是,利用市场情绪分析方法并不会给我们提供每次交易的确切入场和出场点位。但是,不要因此而绝望!利用市场情绪分析法能够帮助你决定,你是否应该随着市场主流而动。当然,你也可以始终将市场情绪分析和技术以及基本面分析方法结合起来,以做出更好的交易决策。
在股票市场和期货市场中,交易者们能够观察交易量,作为衡量股票和期货市场情绪的指标。如果某一股票价格持续上升,但是成交量却在下降,这可能显示出市场正处于超买状态。或者是,某一持续下跌的股票交成交量突然大幅上升,这可能表明市场情绪正由看空转而看多。
不幸的是,由于外汇市场是场外交易,或者说外汇市场并不存在一个集合交易的场所。这意味着每一次的货币交易量,我们都难以轻易获得。
.jpg)
糟糕,哦不!
没有任何工具来测算外汇外汇市场交易量,交易者该如何来衡量市场情绪呢?
这也是交易者持仓报告应运而生的原因之所在!
Commitment of Traders Report
The COT Report: What, Where, When, Why, and How
The Commodity Futures Trading Commission, or CFTC, publishes the Commitment of Traders report (COT) every Friday, around 2:30 pm EST.
Because the COT measures the net long and short positions taken by speculative traders and commercial traders, it is a great resource to gauge how heavily these market players are positioned in the market.

You’re probably asking yourself, “Why the heck do I need to use data from the FX futures market?”
“Doesn’t the spot forex market have a report that measures how currency traders are positioned?”
“I’m a spot forex trader! Activity in the futures market doesn’t involve me.”
Remember, since spot forex is traded over-the-counter (OTC), transactions do not pass through a centralized exchange like the Chicago Mercantile Exchange.
So what’s the closest thing we can get our hands on to see the state of the market and how the big players are moving their money?
Yep, you got it…
The Commitment of Traders report from the futures market.
Before going into using the Commitment of Traders report in your trading strategy, you have to first know WHERE to go to get the COT report and HOW to read it.
持仓报告
商品期货交易委员会(CFTC)会在美国东部时间每周五的下午2:30左右公布交易商持仓报告(COT)。
由于CFTC持仓报告显示了投机交易者和商业交易者所持有的净多头和净空头情况,所以该持仓报告是测量市场参与者在市场上的所持有头寸状况的重要来源。
.jpg)
随后,我们将介绍你认识这些市场参与者。它们是对冲基金、大的机构投机者、零售外汇投资者等。就像一个球队的队员一样,每一名队员都有他特有的特征和作用。通过对这些队员行为的观察,你将能够提前预判到市场情绪可能出现的转变。
你很可能问自己,“我为什么应该使用来自外汇期货市场上的数据?”
“难道现货外汇市场没有测量货币交易者头寸状况的报告吗?”
“我是一名现货外汇交易者!期货市场和我没有任何关系。”
记住,由于现货外汇市场是场外交易(OTC),交易并不通过某一集合交易场所,比如说芝加哥期货交易所。
那么,我们了解市场状况以及大型机构投资者资金移动状况的最接近的途径是什么呢?
你可能已经猜到了。
就是来自期货市场的交易者持仓报告。
在你使用持仓报告指导你的交易之前,你首先应该知道在哪里获得COT报告,以及如何解读这份报告。
How to Find the COT Report
Step 1:
Open up the address below in your web browser. (http://www.cftc.gov/marketreports/commitmentsoftraders/index.htm)
![]()
Step 2:
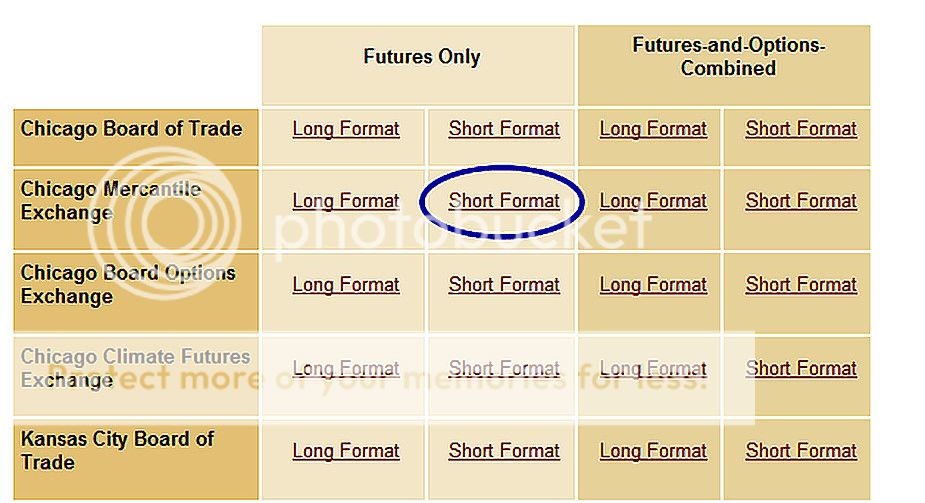
Once the page has loaded, scroll down a couple of pages to the “Current Legacy Report” and click on “Short Format” under “Futures Only” on the “Chicago Mercantile Exchange” row to access the most recent COT report.

Step 3:
It may seem a little intimidating at first because it looks like a big giant gobbled-up block of text but with a little bit of effort, you can find exactly what you’re looking for. Just press CTRL+F (or whatever the find function is of your browser) and type in the currency you want to find.
To find the British Pound Sterling, or GBP, for example, just search up “Pound Sterling” and you’ll be taken directly to a section that looks something like this:

Yowza! What the heck is this?! Don’t worry. We’ll explain each category below.
- Commercial: These are the big businesses that use currency futures to hedge and protect themselves from too much exchange rate fluctuation.
- Non-Commercial: This is a mixture of individual traders, hedge funds, and financial institutions. For the most part, these are traders who looking to trade for speculative gains. In other words, these are traders just like you who are in it for the Benjamins!
- Long: That’s the number of long contracts reported to the CFTC.
- Short: That’s the number of short contracts reported to the CFTC.
- Open interest: This column represents the number of contracts out there that have not been exercised or delivered.
- Number of traders: This is the total number of traders who are required to report positions to the CFTC.
- Reportable positions: The number of options and futures positions that are required to be reported according to CFTC regulations.
- Non-reportable positions: The number of open interest positions that do not meet the reportable requirements of the CFTC like retail traders.
If you want to access all available historical data, you can view it here.
You can see a lot of things in the COT report but you don’t have to memorize all of it.
As a budding trader, you’ll only be focusing on answering the basic question:
“Wat da dilly on da market yo?!”
Translation: “What’s the market feeling this week?“
使用COT的3个简单步骤
第1步:
在你的浏览器打开以下的网页 (http://www.cftc.gov/marketreports/commitmentsoftraders/index.htm )
![]()
第2步:
当页面显示完后,滑鼠向下滚动两下,直到你看见到 “Current Legacy Report” 的标题,寻找在”Futures Only“和”Chicago Mercantile Exchange” 栏位,交叉的”Short Format“。点击就可以获得最新的COT报告了。
第3步:
虽然它刚开始看起来可能有点可怕,因为它就像是个用一块块文字堆起来的大巨人,但只要随着一点点的努力,您就可以准确地找到您所要的了。你只需要按下Ctrl + F(或您浏览器上的任何搜索功能)就可以了。
要搜索英镑或是GBP,你只需要搜索“Pound Sterling”或是“GBP”,你就会直接跳到你想要的数据区域,看起来像这样:
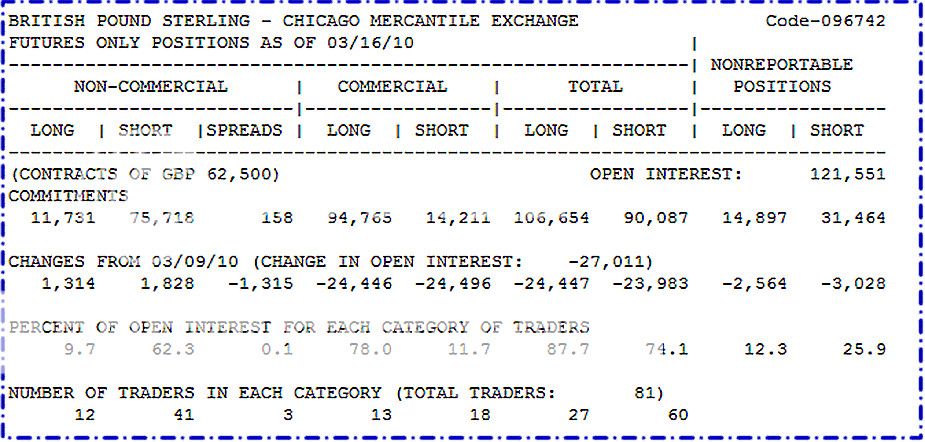
哎呀!这到底是什么鬼东西?!不要担心,我们会解释每个项目给你。
• Commercial(商业头寸):
这是些大财团和企业,使用外汇期货来对冲风险,以保护他们的生意,免受汇率波动的影响。
• Non-Commercial(非商业头寸):
这是混合了个人投资者、对冲基金和金融机构等。大多数的情况,这些交易者们都是为了投机获利才进行交易。换句话说,这些交易者们就像你一样,是为了印有本杰明肖像的钞票才交易的。
• Long(多头头寸):这是报告给CFTC的多头合同数量。
• Short(空头头寸):这是报告给CFTC的空头合约数量。
• Open interest(未清算合约):
这列表示的是,套期保值和未平仓头寸,的所有合约总数
• Number of traders(交易商人数):
这是向商品期货交易委员会报告头寸,的所有交易商人数。
• Reportable positions(需要交报告的头寸):
需要向商品期货交易委员,缴交日常报告的期权和期货,的大仓位数量。
• Non-reportable positions(不需要交报告的头寸):
不需要向商品期货交易委员,缴交日常报告的期权和期货,的小仓位数量。
如果您像要获得所有的可用历史数据,您可以在这里查看。
你可以在这报告中看到很多东西,但你不必记住报告内的所有东西。
作为一个刚刚发芽的交易者,你只需集中精力,解答这基础的问题:
“Wat da dilly on da market yo?!?”
翻译:“外汇市场这周的情绪如何?”
Understanding the COT Report
In order to understand the futures market, first you need to know the people making the shots and those who are warming up the bench. These players could be categorized into three basic groups:
- Commercial traders (Hedgers)
- Non-commercial traders (Large Speculators)
- Retail traders (Small Speculators)
Don’t Skip the Commercial – The Hedgers
Hedgers or commercial traders are those who want to protect themselves against unexpected price movements. Agricultural producers or farmers who want to hedge (minimize) their risk in changing commodity prices are part of this group.
Banks or corporations who are looking to protect themselves against sudden price changes in currencies or other assets are also considered commercial traders.
A key characteristic of hedgers is that they are most bullish at market bottoms and most bearish at market tops.
What the hedgehog does this mean?

Here’s a real life example to illustrate:
There is a virus outbreak in the U.S. that turns people into zombies. Zombies run amok doing malicious things like grabbing strangers’ iPhones to download fart apps.
It’s total mayhem as people become disoriented and helpless without their beloved iPhones. This must be stopped now before the nation crumbles into oblivion!
Guns and bullets apparently don’t work on the zombies. The only way to exterminate them is by chopping their heads off.
Apple sees a “market need” and decides to build a private Samurai army to protect vulnerable iPhone users.
It needs to import samurai swords from Japan. Tim Cook, the CEO of Apple, contacts a Japanese samurai swordsmith who demands to be paid in Japanese yen when he finishes the swords after three months.
Apple also knows that, if the USD/JPY falls, it will end up paying more yen for the swords.
In order to protect itself, or rather, hedge against currency risk, the firm buys JPY futures.
If USD/JPY falls after three months, the firm’s gain on the futures contract would offset the increased cost on its transaction with the Japanese sword smith.
On the other hand, if USD/JPY rises after three months, the firm’s loss on the futures contract would be offset by the decrease in cost of its payment for the samurai swords.
In It to Win It – The Large Speculators
In contrast to hedgers, who are not interested in making profits from trading activities, speculators are in it for the money and have no interest in owning the underlying asset!
Many speculators are known as hardcore trend followers since they buy when the market is on an uptrend and sell when the market is on a downtrend. They keep adding to their position until the price movement reverses.
Large speculators are also big players in the futures market since they hold huge accounts.
As a result, their trading activities can cause the market to move dramatically. They usually follow moving averages and hold their positions until the trend changes.
Cannon fodders – The Small Speculators
Small speculators, on the other hand, own smaller retail accounts. These comprise of hedge funds and individual traders.
They are known to be anti-trend and are usually on the wrong side of the market. Because of that, they are typically less successful than hedgers and commercial traders.
However, when they do follow the trend, they tend to be highly concentrated at market tops or bottoms.
理解这三个组的分别
为了明白期货市场,首先你需要认识那些负责投篮的人和那些负责坐热板凳的人。
这些玩家基本可以分为三个组别:
1. 商业交易者们(对冲机构们)
2. 非商业交易商们(大型投机商们)
3. 零售交易商们(小型投机商们)
不要忽略了商业贸易 – 对冲机构们
对冲机构或商业交易者,是那些想要保护自身的产品,免受价格的波动伤害的人。例如农业生产者和农民,想要通过期货来对冲(风险最小化)掉,农产品在未来不断变化的商品价格,所以他们也是这组的成员之一。
那些银行或企业们,为了防范本身的生意,因为货币的汇率,或商品的价格,突然出现变化的影响,他们也被视为商业交易者。
对冲机构们的一个主要特点是,在市场底部时多数看涨 和 在市场顶部时多数看跌。
这些经验老道的刺猬们,为什么会这样看?
下面是一个活生生的说明例子:
 米国的病毒突然爆发,把人都变成了僵尸。僵尸们四处横行作恶,它们乱抢陌生人的iPhone,来下载垃圾程序。
这使得人们开始出现混乱,因为失去了他们心爱的iPhone,导致晕头转向和茫然不知所措。这情况必须在国家被击垮崩溃之前,立即采取措施制止!
枪支和炮弹,明显对僵尸不起作用。唯一消灭他们的方法,只有砍掉他们的脑袋,才能消灭他们。
苹果公司看到了“市场的需求”,并决定要打造一支个私人的武士军队,来保护脆弱的iPhone用户。
这需要从日本进口武士刀。Steve Jobs联络到售卖日本武士刀的铸剑师,他们要求在完成宝刀的三个月后,用日元付款。
苹果公司也知道,如果美元/日元在三个月后下跌,他们的宝刀最终将支付更多的日元。
苹果公司为了保护自己,或者说,为了对冲掉货币的风险,公司决定买进日元期货。
如果美元/日元在三个月后下跌,那么公司在期货的合同就会盈利,这将抵消掉日本铸剑师订单成本上升的亏损。
另一种情况,如果美元/日元在三个月后上涨,虽然公司的期货合约会亏损,但因为支付武士刀的成本同样下降了,所以也抵消掉了。
为了赢钱而来的 – 大型投机商
与套期保值的对冲机构不同,因为大型投机商对期货的实货买卖,毫不感兴趣。他们进入市场,为的是赚进绿油油的钞票,而不是对拥有那些绿油油的野菜感兴趣。
许多大型投机商被认为是趋势交易的中坚分子,因为在市场处于牛市时,他们就买进;而当市场处于熊市时,他们就卖出。他们不断的增加仓位,直到价格的趋势反转。
大型投机商,同时也是期货市场上的大牌球员,因为他们拥有庞大的帐户。
因此,他们的交易活动,也会导致市场的大幅移动。他们一般都按照移动平均线交易,和持有他们的仓位,直到趋势改变。
市场的炮灰 – 小型投机者
小型投机者,另一种说法,也叫做散户。这里包括了对冲基金和个人交易者。
他们是众所周知的逆势交易者,通常站在市场错误的一边。正因为如此,比起对冲机构们和商业贸易的交易者们,小型投机者们通常很少可以取得成功的。
可是,当他们都顺应趋势时,他们往往是被高度集中在,市场的顶部或底部。
How to Use the COT Report for Trading
Since the COT report comes out weekly, its usefulness as a market sentiment indicator would be more suitable for longer-term trades.
The question you may be asking now is this:
How the heck do you turn all that “big giant gobbled-up block of text” into a sentiment-based indicator that will help you grab some pips?!
One way to use the COT report in your trading is to find extreme net long or net short positions.
Finding these positions may signal that a market reversal is just around the corner because if everyone is long a currency, who is left to buy?
No one.
And if everyone is short a currency, who is left to sell?
What’s that?
Pretty quiet…
Yeah, that’s right. NO ONE.
One analogy to keep in mind is to imagine driving down a road and hitting a dead end. What happens if you hit that dead end? You can’t keep going since there’s no more road ahead. The only thing to do is to turn back.
Let’s take a look at this chart of the EUR/USD from TimingCharts:

On the top half, we’ve got the price action of EUR/USD going on. At the same time, on the bottom half, we’ve got data on the long and short positions of EUR futures, divided into three categories:
- Commercial traders (blue)
- Large Non-commercial (green)
- Small non-commercial (red)
Ignore the commercial positions for now, since those are mainly for hedging while small retail traders aren’t relevant.
Let’s take a look at what happened mid-way through 2008. As you can see, EUR/USD made a steady decline from July to September. As the value of the net short positions of non-commercial traders (the green line) dropped, so did EUR/USD. In the middle of September, net short positions hit an extreme of 45,650. Soon after, investors started to buy back EUR futures. Meanwhile, EUR/USD rose sharply from about 1.2400 to a high near 1.4700!
Over the next year, the net value of EUR futures position gradually turned positive. As expected, EUR/USD eventually followed suit, even hitting a new high around 1.5100. In early October 2009, EUR futures net long positions hit an extreme of 51,000 before reversing. Shortly after, EUR/USD began to decline as well.
Holy Guacamole! Just by using the COT as an indicator, you could have caught two crazy moves from October 2008 to January 2009 and November 2009 to March 2010.
The first was in mid-September 2009. If you had seen that speculative traders’ short positions were at extreme levels, you could have bought EUR/USD at around 1.2300. This would have resulted in almost a 2,000-pip gain in a matter of a few months!
Now, if you had also seen that net long positions were at an extreme in November 2009, you would have had sold EUR/USD and you could have grabbed about 1,500 pips!
With those two moves, by using the COT report as a market sentiment reversal indicator, you could have grabbed a total of 3,500 pips. Pretty nifty, eh?
COT报告的交易策略
由于COT报告每周出版一次,所以它更适合于长线交易者,作为一个衡量市场情绪的指标。
你现在可能会问:
到底你该怎样做,才能把这些的“文本块堆成的大巨人”,转变成一个以情绪为基础的指标,来帮助你抓取一些点子呢 ?!
其中一种利用持仓报告,来帮助你交易的方法,就是查找 那些极端的净多头或净空头头寸。
查找这些头寸,可以用来预测市场的大翻转即将到来。因为如果每个人都做多了一个货币的话,市场哪里还有买家呢?
一个人都没有了。
或者是每个人都做空了一个货币,那市场哪里还有卖家呢?
那代表着什么?
非常的安静…
对了,非常正确的。一个买家(或卖家)都没有了。
当最后的买家(或卖家)都进了场,谁还能来让价格继续走下去呢?一个要牢记着的比喻,想象你开车走进了死胡同。当你进入了死胡同,会发生什么事呢?你不可能继续把车开下去,因为前面没有太多的路可以让你前进了。这时唯一可以做的就是倒车往回走。
让我们来看看来自 TimingCharts 的,欧元/美元图表:
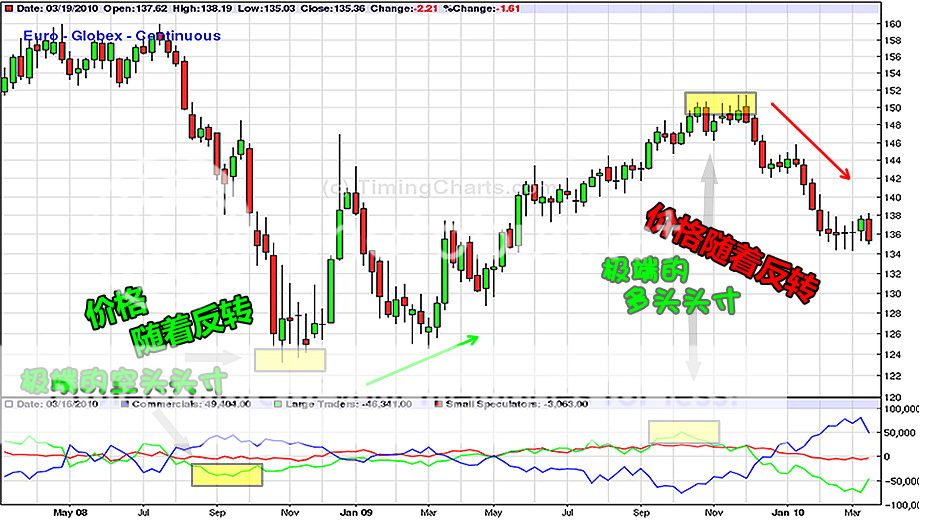
在图表的上半部分,我们可以看到欧元/美元最新的价格走势。同时在图表的下半部分,我们根据欧元期货的,多头和空头的头寸数据,分为三类:
• 商业交易者(蓝色)
• 大型非商业交易者(绿色)
• 小型非商业交易者(红色)
从现在开始,先忽略掉商业交易者的头寸,因为这些头寸主要是为对冲套利。而小型非商业交易者的头寸,都是些小投机客,所以也不用理会。
让我们来看看到2008年中期发生了什么事。 正如你看到的,欧元/美元从七月至九月期间,一直平稳下滑。而大型非商业交易者的净空头头寸价值(绿线)却一直下降,欧元/美元确实是如此。在九月中旬,净空头头寸创下45,650的极端数据。不久之后,投资者开始积极买回欧元期货。与此同时,欧元/美元从1.2400 大幅攀升到1.4700附近!
在接下来的一年,欧元期货的头寸净值,逐步转向积极的一方。正如所预期的那样,欧元/美元的价格最终也跟随攀升,甚至触及1.5100左右的新高。在2009年10月初,欧元期货的多头头寸净值,在达到51,000的极端后,才开始反转。不久后,欧元/美元也开始直线下滑。
找到交易的圣鳄梨酱了! 只要把 COT当做指标,你就可以抓住市场的两段疯狂行情:从2008年10月至2009年的1月,和2009年11月至2010年的3月。
第一次是在2009年的九月中旬。 如果你已经注意到大型投机交易者的空头头寸在极端的水平,你应该在1.2300的价位附近买进欧元/美元。这将让你在短短的几个月内,赚进大约2,000点的利润!
现在,如果你同样又注意到,净多头的头寸在2009年11月处于极端的水平,你应该肯定会卖出欧元/美元,然后你又捞到大约1,500点了!
这两笔交易,仅仅只是使用COT报告,作为一个市场情绪反转的指标,您就可以赚得3,500点。相当的漂亮,是吧?
How to Pick Tops and Bottoms With the COT Report
As you would’ve guessed, ideal places to go long and short are those times when sentiment is at an extreme.
If you noticed from the previous example, the speculators (green line) and commercials (blue line) gave opposite signals. While hedgers buy when the market is bottoming, speculators sell as the price moves down.
Here’s that COT report chart again:

Hedgers are bearish when the market moves to the top while speculators are bullish when the price is climbing.
As a result, speculative positioning indicates trend direction while commercial positioning could signal reversals.
If hedgers keep increasing their long positions while speculators increase their short positions, a market bottom could be in sight.
If hedgers keep adding more short positions while speculators keep adding more long positions, a market top could occur.
Of course, it’s difficult to determine the exact point where a sentiment extreme will occur so it might be best to do nothing until signs of an actual reversal are seen.
We could say that speculators, because they follow the trend, catch most of the move BUT are wrong on turning points.
Commercial traders, on the other hand, miss most of the trend EXCEPT when price reverses.
Until a sentiment extreme occurs, it would be best to go with the speculators.
The basic rule is this: every market top or bottom is accompanied by a sentiment extreme, but not every sentiment extreme results in a market top or bottom.
抓住顶部和底部
正如您应该已经猜到,当做空或做多交易的时候,最理想的位置,是当市场情绪
极端
的时候。
如果你有注意前面的例子,会发现:大型投机者(绿线)和商业贸易者(蓝线)呈现出相反的信号。正当商业对冲者,在外汇市场触底开始买进时;大型投机者却随着价格的下滑,不断卖出。
还是同一张图:
当市场价格上升接近顶部的时候,商业对冲者多数已经全部做空市场。而大型投机者却随着市场价格的攀升,还在不断买进。
因此, 大型投机者的持仓头寸,可以用来指出趋势的方向;而 商业对冲者的持仓头寸,可以用来指出趋势逆转 。
如果商业对冲者大量增加其多头头寸,而大型投机者还在增加其空头头寸,市场底部可能就在眼前。
如果商业对冲者不断大量增加空头头寸,而大型投机者还在增加多头头寸,市场顶部即将出现。
当然,要求精确的指出,市场情绪达到哪个极端位置会反转,这时很难的。所有,我们最好是什么也不做,等到一个实际的反转迹象出现,才开始行动。
我们可以这样形容大型投机者们,他们追随趋势,所以准确抓住了市场波段的大部分,但是往往在反转点上出现问题。
另一方面,商业交易者们,错过了大部分的趋势利润,除了多数准确抓住价格的反转。
所以,除非出现一个极端情绪的迹象,不然跟随大型投机者们的步伐,是最好的选择。
基本的规则是这样:每个市场的顶部或底部,都是伴随着极端情绪下形成的。但不是每个极端情绪的出现后,市场都会形成顶部或底部。
How to Create Your Own COT Trading Indicator

Having your very own COT indicator is like having your own pony.
Using the COT report can be quite useful as a tool for spotting potential reversals in the market.
There’s one problem though, we cannot simply look at the absolute figures printed on the COT report and say, “Aha, it looks like the market has hit an extreme… I will short and buy myself 10,000,000 pairs of socks with my easy profits.”
Determining extremes can be difficult because the net long and short positions are not all relevant. What may have been an extreme level five years ago may no longer be an extreme level this year. How do you deal with this problem?
What you want to do is create an index that will help you gauge whether the markets are at extreme levels. Below is a step-by-step process on how to create this index.
- Decide how long of a period we want to cover. The more values we input into the index, the less sentiment extreme signals we will receive, but the more reliable it will be. Having less input values will result in more signals, although it might lead to more false positives.
- Calculate the difference between the positions of large speculators and commercial traders for each week.
The formula for calculating this difference is:
Difference = Net position of Large Speculators – Net position of Commercials
Take note that if large speculators are extremely long, this would imply that commercial traders are extremely short. This would result in a positive figure.
On the other hand, if large speculators are extremely short, that would mean that commercial traders are most likely extremely long; this would result in a negative figure.
- Rank these results in ascending order, from most negative to most positive.
- Assign a value of 100 to the largest number and 0 to the smallest figure.
And now we have a COT indicator! This is very similar to the RSI and stochastic indicators that we’ve discussed in earlier lessons.
Once we have assigned values to each of the calculated differences, we should be alerted whenever new data inputted into the index shows an extreme: 0 or 100. This would indicate that the difference between the positions of the two groups is largest, and that a reversal may be imminent.
Remember, we are interested in knowing whether the trend is going to continue or if it is going to end. If the COT report reveals that the markets are at extreme levels, it would help pinpoint those tops and bottoms that we all love so much.
We dug around the forums and found this little gold nugget for you. Apparently you can download the COT indicator if you’re trading on an MT4 platform and you can find the link in our COT data to indicator forum thread!
你自己专属的COT指标

拥有你自己专属的COT指标,就像你拥有了自己的小马一样。
使用COT报告是相当有用的工具,它可以用来找出市场潜在的反转迹象。
但是,还有一个问题,我们不能只是简单地,就看着COT报告上印着的数字,就说:“啊哈,看来市场已经达到了极端 … … 我将做空,并为自己买10,000,000对的短袜子。”
要精确的判断出,头寸的极端水平是非常困难的,因为净多头和空头头寸的头寸,并不是全部都相互关联的。五年前的一个极端水平,再今年可能已不再是一个极端的水平。你该如何处理这个问题呢?
你要做的就是创建一个指数,这将有助于你评估,市场是否正处于极端的水平。下面是一个按步就班的过程,教你怎样制作这个指数。
1. 决定一个我们想要覆盖的周期长度。我们输入到指数的平均值越多,收到的极端情绪信号就越少,
但它会更可靠。输入较少的平均值将导致更多的信号,但是它也可能导致更多的错误。
2. 每星期计算大型投机者们,与商业交易者们之间的,头寸差异。
计算这种差异的公式为:
差异=大型投机者们的净头寸 – 商业交易者们的净头寸
注意,如果大型投机者们在极端做多,这可能意味着,商业交易者们在极端做空。这将产生正数的数字。
另一方面,如果大型投机者们在极端做空,这可能意味着,商业交易者们在极端的做多,
而这会导致一个负数的数字。
3. 把得到的结果按递增的顺序排列,由最小的负数到最大的正数。
4. 分配数值,由最大的正数100,到最小的负数0。
现在我们也有了一个COT指标!这和我们曾经在前面讨论过的,RSI或随机指标非常相似。
一旦我们分配数值0-100给每一个计算出来的差异后,我们应该警惕,只要当新的数据输入时,该指数显示出一个极端的-0或是100。这表明两组别之间的头寸差异已经最大化,反转可能即将发生。
请记住,我们是对趋势感兴趣,想知道它究竟会继续走下去,或是将要反转。如果COT报告显示出市场在极端的水平,这将有助于我们较精确的找出顶部和底部,我们都爱这么做。
How to Interpret the COT Report
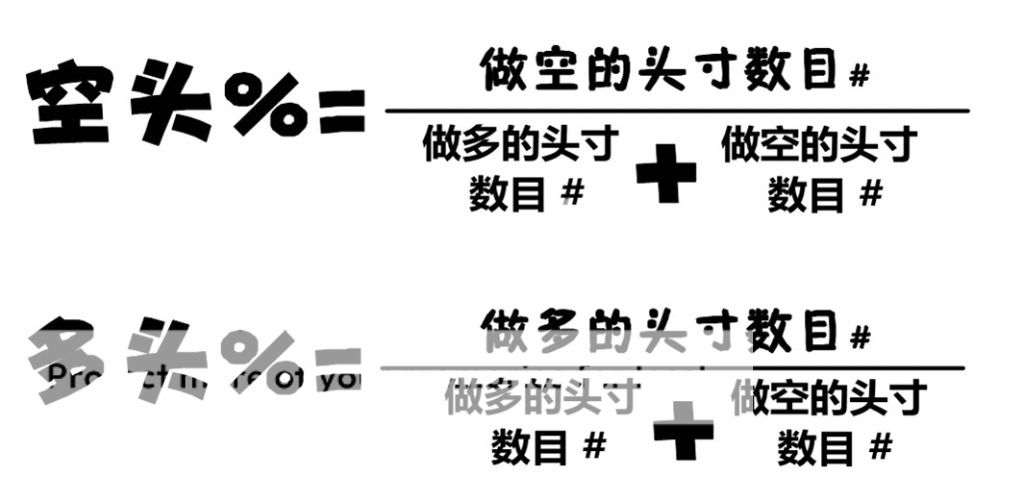
Now that we know how to determine sentiment extremes, what’s next? Recall that not every sentiment extreme results in a market top or bottom so we’ll need a more accurate indicator. Calculating the percentage of speculative positions that are long or short would be a better gauge to see whether the market is topping or bottoming out. The equation to calculate for the %-long and %-short is indicated below:

To illustrate this better, let’s go back a few years and see what happened with Canadian dollar futures. Going through the COT reports released on the week ending August 22, 2008, speculators were net short 28,085 contracts. On March 20, 2009, they were net short 23,950 contracts.
From this information alone, you would say that there is a higher probability of a market bottom in August since there were more speculators that were short in that period. But hold on a minute there… You didn’t think it would be THAT easy right?

A closer look would show that 66,726 contracts were short while 38,641 contracts were long. Out of all the speculative positions in August (66,726 / (38,641 + 66,726)), 63.3% were short positions.
On the other hand, there were just 8,715 long contracts and 32,665 short contracts in March. This means that (32,655 / (8,715 + 32,665)) 78.9% of the speculative positions were short positions during that period. What does this mean?
There is a higher chance that a bottom will occur when 78.9% of all speculative positions are short as opposed to just 63.3%. As you can see on the chart below, the bottom in fact did not occur around August 2008, when the Canadian dollar was worth roughly around 94 U.S. cents.
The Canadian dollar continued to fall over the next few months. By the time March came around and the %-short ratio hit 78.9%, the Canadian dollar had hit a bottom around 77 U.S. cents. Then what happened? It started to steadily rise!
A market bottom? Yep, you got it.
更深入的研究数据
现在我们已经知道如何判断市场的极端情绪,下一步是什么?先回想一下,每次市场出现极端情绪时,并不是每次都会出现价格的顶部或底部,因此我们需要一个更准确的指标。因此使用百分比来计算,大型投机商的头寸是偏向多头还是空头,可以更好的衡量出,市场是处于上升乏力,还是正走出低谷。
它们的计算公式:空头的%和多头的%,分别表示如下:
为了更好地说明这一点,让我们回到数年前,看看加拿大的货币期货,当时发生了什么事。
往前翻看至2008年8月22日的持仓报告走向,大型投机者的净空头头寸,最低是28,085。如果在2009年3月20日,大型投机者的净空头达到23,950的低点。如果单从这两个信息,你肯定会说在八月份,市场会有更高的概率出现底部,因为还有更多的大型投机商,会在那段时期卖空。
不过,先留步一两分钟 … … 你不会认为这就是真的那么简单吧?
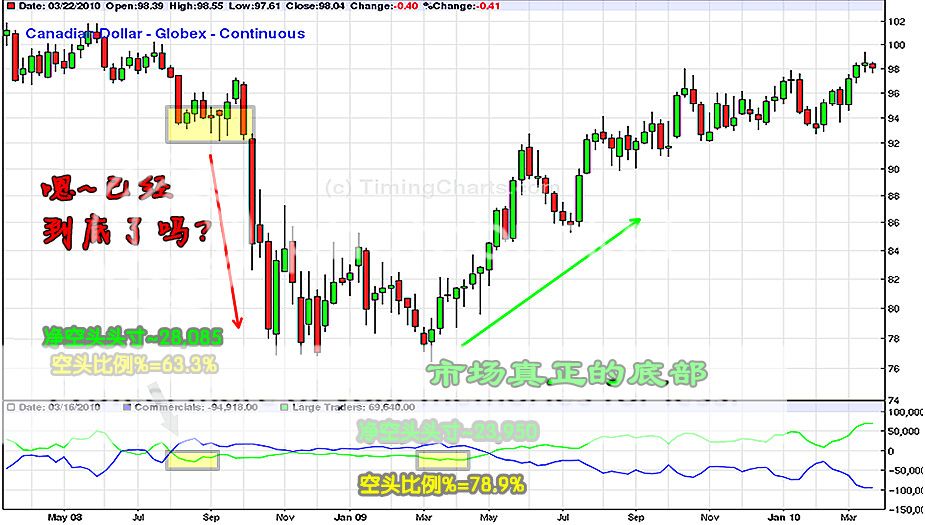
再深入的查看COT,你就会发现空头头寸有66,726,而多头头寸却有38,641。所以在八月份的所有大型投机商头寸中(66,726 / (38,641 + 66,726)),做空的头寸占63.3%。
而另一方面,三月份有共有8,715的多头头寸和32,665的空头头寸。这意味着有(32,655 / (8,715 + 32,665)) 78.9%的大型投机商在这段时期,持有空头的头寸。
这些意味着什么呢?这些意味着,相对于只有仅仅的63.3%,当所有的大型投机商持仓的头寸,高达78.9%的空头头寸时,市场有更高的几率,会形成底部。
正如你可以在上面的图表中看到,事实上底部并没有出现在2008年的8月份附近,当时加拿大货币的价值已经升至94美分附近了。虽然加拿大货币的价格,在之前持续数个月的下滑。但直到三月份的时候,空头的持仓比率高达78.9%时,加拿大货币跌至77美分附近的底部后。然后,发生了什么事? 加拿大货币开始稳步上扬!一个市场的底部? 是的,你说对了。
Summary Of Market Sentiment

Did those thousand-pip moves excite you?
Before we start betting the farm based on our analysis of the COT report, remember that those were just specific cases of when the COT report signalled a perfect market reversal.
The best thing to do would be to back test and look at reasons why a reversal took place.
Was the economy booming?
Or was it in the middle of a recession?
Remember, the COT report measures the sentiment of traders during a specific period of time. Like every other tool in your toolbox, using the COT report as an indicator does not always correlate to market reversals. So take the time to study this report and get your own feel of what works and what doesn’t.
Also, before we bring this lesson to an end, always keep in mind that market prices aren’t driven by solely COT reports, stochastic, Fibonacci levels, etc.
The markets are driven by the millions of people reacting to economic analysis, fundamental reports, politics, Godzilla attacks, UFO sightings, Lady Gaga concerts – life in general! It is how you use these tools that will help you be prepared to what lies ahead.
In conclusion…
- As forex traders, it is our job to gauge what the market is feeling.
- One way to gauge market sentiment extremes is through the Commitment of Traders Report.
- By understanding the activities of the three groups of traders (commercial traders, non-commercial, retail traders), we can find ourselves in better positions to fish for tops and bottoms.
- Remember, every market top or bottom is accompanied by a sentiment extreme, but not every sentiment extreme results in a market top or bottom.
总结:市场情绪

这些数以千计的点数移动,有使你感到振奋吗?
在我们开始拿出所有的家产来赌注在,一个以COT报告为基础的分析结果之前。请记住,前面的那些特殊案例,都是在COT报告发出一个,完美市场反转的信号时候。
最好的作法应该是,往回测试和查找反转的因素,看看反转为什么会在那个位置发生。
是因为经济蓬勃发展所导致的吗?
还是因为深陷在经济衰退中?
记住,COT报告是衡量,在一段特定的时期内,交易者们的整体情绪,会如何影响价格。但它就像你指标工具箱的其他工具,COT报告和一般的指标一样,并不能准确的反映出市场的反转。所以,花些时间研究这份报告,并自己感受哪些策略有效,哪些无效。
此外,在我们结束本课程之前,您要始终牢记,市场的价格移动,不是纯粹的由COT报告、随机震荡指标、还是斐波纳契位置等等,所造成的。
市场的价格移动是由成千上万的人,根据:经济分析、基本面数据、政治因素、日本怪兽Godzilla的袭击、不明飞行物体UFO的目击报导、性感天后Lady GaGa的流行音乐演唱会等等 —— 各种日常生活发生的普通事件,所做出的反应。重点是你如何使用这些工具,来帮助你提前做好准备,居盈思亏。
总而言之…
• 作为交易者们,我们要做的,就是时刻衡量市场的情绪,是否受到什么的影响。
• 而衡量市场极端情绪的方法之一,就是使用交易商的持仓报告。
• 通过了解三个组别的交易商们(商业交易商、非商业交易商、零售交易商),的持仓情况,
我们可以顺利为自己的找到更好的位置,在市场的顶部或底部,开始钓鱼。
• 切记,每个价格波动的顶部或底部,都伴随着市场极端的情绪;但并不是每次市场出现极端情绪时,价格就会出现顶部或底部。
Web content composed with the free instant HTML code editor.